A Reflection on Digital Differences…
Digital Differences… A real ‘eye-opener’
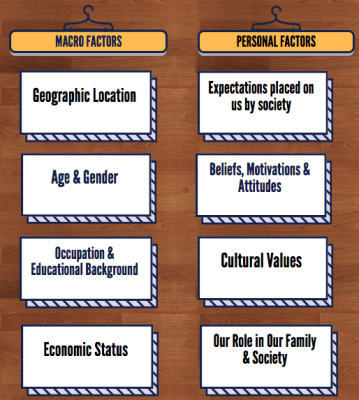
Having written about ‘Digital Differences’ and seen everything my fellow bloggers have to say, I can confirm that it has opened my eyes as to how influential macro and personal factors are when it comes to using the web.
Figure 1: My Top 5 Web Practices
Created using ‘canva’ by Karishma Bhakar
Figure 1 shows my web practices as a young female student.
Continue reading →

