
Datasets
More Little Wins
July 12, 2016
by Ash Smith
It was recently pointed out to us here in Open Data HQ that we don’t blog enough. We do a lot of things but most of them are little wins and not worth their own blog post. However, we’ve had enough little wins recently that it’s worth writing a paragraph or two about all of them.
Public People IDs
We have always had a few datasets containing information about people. The ePrints dataset, the public phonebook and, more recently, the facilities data all contain people triples. Sadly none of them linked up. This obviously troubled me.
We’ve always been a little timid around personal data. It’s a tough area – one wrong move and you’ll never live it down. Some businesses have been forced to close down due to poor management of personal data. Also, what some might consider acceptable some may not. I notice trends around the University – for example, most people in WAIS already have a public ‘people’ page, containing their email address, their degree and maybe a few other things, and see no wrong in it at all. Researchers actually need a public identity on their institutional website, it’s the way they communicate with other researchers and increase their reputation. But if I were to tell the groundskeeper or the staff in catering that their email addresses and photos are all going to be made public, they would probably be quite strongly opposed to the idea, and quite rightly so. I have no right to publish their personal information without their permission, and certainly not as open data.
We believe we have a compromise. We’ve assigned everyone in the University a URI, but that’s it. Occasionally these URIs resolve to something other than a blank page, but this only currently happens if (a) they have explicitly agreed to be in the public phonebook, (b) are the contact for a piece of equipment in our equipment database, or (c) I’ve added a bunch of information just for laughs (see http://data.southampton.ac.uk/person/D5mY.html for an example.) Even these pages are not visible to Google, and they are not centrally linked from anywhere so you can’t just scrape all the public people (unless you use the SPARQL endpoint I guess). But the point is that even people who have given us permission to publish their information are quite well hidden from Bad People™, and nobody else is public at all, even though we can refer to them in other datasets if we need to. I’m working with the team responsible for the recent main website re-brand, so I’ll link all this in with actual departmental people pages when I can. The main point is that everyone has a URI now, and these URIs are completely obfuscated and non-sequential, and (externally, at least) there is absolutely nothing you can do with them unless the person to which it refers is OK with their data being public. But we can use them to refer to people, and you can be sure the person referred to within one dataset is the same person being referred to by another.
An interesting quirk we encountered (hopefully before it caused any problems!) was what we lovingly refer to as the ‘four letter word problem’. The URIs referring to people were created by generating random numbers starting at over a million (so nobody gets to be ‘number 1’) and then base64-encoding them. The result is a four-digit alphanumeric string which means nothing, and this gets added to the URI. Someone pointed out to us that we run the risk of accidentally generating something along the lines of ‘D0rk’, and the poor person who gets assigned this ID won’t be too happy. Realising there are other (often far worse) four-letter words that might be accidentally generated, we found a digital copy of the dictionary and cross-checked every ID we’d generated and re-generated it if it was a dictionary word. Now whenever we generate a new ID, for a new member of staff, we check against a dictionary before ‘releasing’ the URI into the wild.
Waste Map
http://tools.southampton.ac.uk/waste-map/
This is an embeddable map of all the waste points on our many campuses. It’s particularly useful for people living in halls of residence, but is also used by Estates and Facilities when working with external contractors.
Nightingale Foyer Report
In the Nightingale building foyer there is a little touch-screen display from which anyone can look up the people who work in that building. The data comes from the Open Data Service, but we had to build a custom version of the data because of the embedded staff from professional services who also work in the building alongside the Nursing and Midwifery staff.
Room Shapes and Divisions
You will almost certainly have seen our lovely digital map, for which I am eternally grateful to Christopher Baines. It uses data from Open Street Map and our own open data, but in many cases where data does not exist, Chris went and created it anyway. The best example of this are the room shapes. Zoom in as far as you can on the map and the building shapes will open up into partial floor plans. We are actually not allowed to publish full floor plans for security reasons, but publicly accessible rooms are fair game. I’m currently working on a more maintainable version of the map, so I’ve taken the opportunity to convert all of Chris’ lovely polygons into an RDF description and published them as a dataset.
Additionally, I was asked a long time ago by one of the lab managers in Building 32 if the bays had URIs. The whole of levels 3 and 4 of Building 32 make up a big open plan lab area for Web Scientists, and this is split into bays of four to six people. At the time the bays didn’t have any URIs but I figured that because I’m the University’s only Linked Open Data specialist, it’s probably my job to assign them! So I did, and built a dataset describing their physical position within the lab.
ATMs
We’ve always had a list of ATMs on campus as part of the Amenities dataset, but that’s as far as it goes. A colleague of ours, Martin Chivers, suggested we include the location of all the ATMs in Southampton, and that the information is all available from various websites already. A few hours of googling added to my own personal knowledge and we now have a spreadsheet of ATM points for the central Southampton and Highfield areas. I’ll try to keep it up to date but the amenities dataset is manually maintained so I apologise if I miss one or two. Looking to the future, I believe we can keep this up to date automatically using Open Street Map, although this is basically crowd-sourced data and we’d like something better. The Link website actually contains a search engine for ATMs in Southampton, but this is almost certainly not open data and we have no right to republish it. So this remains an ongoing project.
Open Day Events
We’ve had lists of open day events before, but this year someone has already gone through the hassle of entering them all into our mobile app, MySouthampton. One Android phone and a copy of WireShark later and I’ve worked out where it gets its data and mercilessly stolen it! This of course means that the open data is up-to-date as long as MySouthampton is. I’ve described the events in the same way as we currently do seminars, etc, so you can always tell when it’s open day because suddenly all the buildings pages have enormous lists of events.
Building Entrance Data
August 7, 2014
by Ash Smith
The University’s Web and Internet Science research group recently had their annual “WAIS Fest”. This is a few days every year in which the researchers all down tools and do something fun and interesting. It gives them all a chance to work with people they may not always work with – important in such a large research group – but also it allows the group to try some things they may not normally be able to get done in their normal line of work. WAIS Fests are nearly always productive. In the past, WAIS Fest themes have actually become the basis of prize-winning research publications, and even started funding bids. The Open Data Service have benefited from these events in the past, which is why we always make a point of getting involved.
This year, I ran my own theme: crowdsourcing data. We’re getting pretty good at getting information from the various sub-organisations of the university, usually by showing that linking open data makes it greater than the sum of its parts. But there is some information that simply doesn’t exist in any University system, and one thing we are missing is entrance and exit information for the buildings on campus. Buildings and Estates don’t keep this information, so it’s up to us to get hold of it somehow. So our idea was to come up with a way of making it simple to curate a dataset in this way. The other nice thing about Estates not having official identifiers and descriptors for building portals is that we got to make our own, and craft the URIs as we like.
We were actually dealt a useful trump card in our quest. Our team was made up of Chris and myself, and also Alex Hovden, a WAIS summer intern. Alex uses a motorised wheelchair to move about and has had a few problems operating some of the lab doors, which are not easy for wheelchair users to operate. So when Alex volunteered to go around campus making notes of the locations of building doorways, we decided he should note down which doors he could not access, and list this in our data as well.
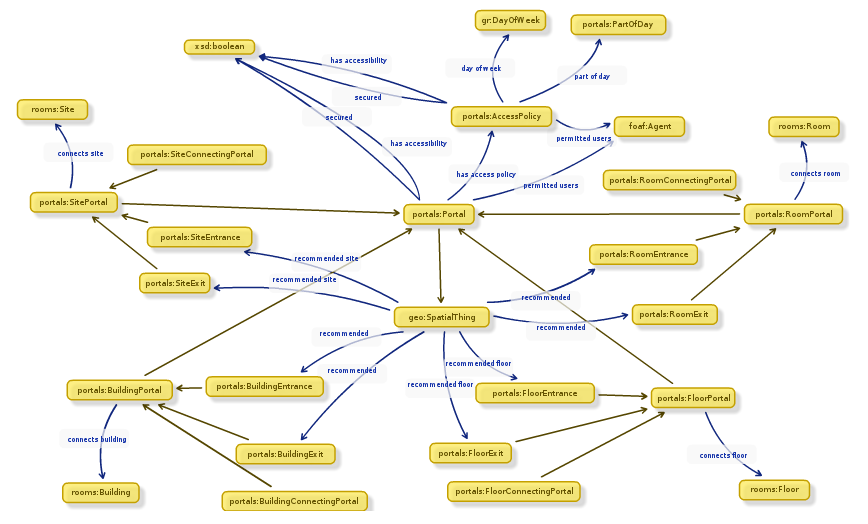 While Alex was off collecting data, Chris and I designed an ontology to describe entryways in linked data. It’s a lot harder than it sounds. To design our ontology we used Neologism, which is an excellent web-based tool for generating ontologies quickly, but the actual modelling process was where most of the work was. We opted for the umbrella term ‘portal’ as it nicely covers all possible entrances to things without explicitly stating entry or exit. A doorway is a portal, so indeed is a tunnel or a bridge. We also had disagreements as to whether or not security properties should be lumped together with access methods, and whether entrance/exit should be a property or a sub-class of the portal class. The task did get a bit serious once or twice as we started considering whether saying “Open Sesame” would count as an access method, and whether or not we should mention pre-1988 daleks in our description of a door with steps (we did.)
Once we had a way of representing the data, it was quite a simple task of writing a script to generate triples from Alex’s spreadsheet, and modifying the pages on data.southampton.ac.uk that describe buildings. Chris also built a smaller, hand-maintained file that lists common learning spaces such as lecture theatres, and which external door is the closest. This is now listed on the room pages, such as on this page about a lecture theatre in the Life Sciences building. Although they’re still lacking information on entry method and access restrictions, we now have a page for all the building external doors on campus that we know about, such as this page, about the south entrance to Building 2, which explains that the entrance has steps and is not easily accessible by people in wheelchairs.
Of course there are always things that don’t go to plan, and we need to learn more about certain things. One idea Chris had for getting latitude/longitude points of the doors was to leave the GPS on his phone on while taking photos of each door, and also take a photo of his feet stood next to each door with the intention of pulling the GPS information from the photo’s EXIF meta-data. This didn’t go as planned because the GPS on some phones isn’t very accurate, and although all of the geo-tagged photos were clearly on campus, many were next to the wrong building. We had plans to ask people to crowdsource spacial data by asking people to send us geo-tagged photographs, but this clearly won’t work.
The other thing we discovered is that RDF is a great way of representing this data because you can simply leave out the bits you don’t know. For example, there were several doors to which we don’t have access, and it’s not always obvious how a door opens unless you can actually open it. We were trying to list which doors require you to push or pull, which open with a push-button and which are on a sensor. It’s usually obvious which doors are on push-button, but unless you can actually see the door opening you can’t determine whether they’re manual or sensor-controlled. It doesn’t help that some things change based on time of day. For example, the doors on building 32 are sensor-controlled during the day, but become card access in the evening.
To conclude, it was another very beneficial WAIS Fest, as the output was not just a new, permanent feature for the Open Data website, but also we learned a lot about crowdsourcing, as well as the design of ontologies that describe something seemingly simple like doorways. The work we did will not just benefit lost students and members of staff, but will also hopefully benefit those with accessibility problems such as wheelchair users.
Room Features updated
January 24, 2013
by Ash Smith
Over the last few weeks, Patrick has been exploring the university’s central data store looking for information on rooms and the features they contain. We’ve always had room features on data.southampton.ac.uk, but they were all generated from a single XML file given to Chris some years ago, and things change over time. So thanks to Pat’s fearless efforts investigating the central Oracle database, we now have a couple of scripts to pull not only room features, but booking information as well. A quick RDF generation script from me later, and we now have a method of ensuring the open data is as up to date as the university’s central database.
This is quite a big deal in my opinion – anyone planning a lecture or event can now view room information from the web and work out which rooms are suitable and available at the required time without having to phone Estates or walk across campus in the rain. Also, updating our data after such a long time is interesting for noting how things change over time; if nothing else, audio/visual technology is improving while chalk blackboards are definitely getting rarer!
New additions to data.southampton.ac.uk
October 15, 2012
by Ash Smith
 My name may not be familiar to people who follow this blog, so I’ll introduce myself first of all. I’m Ash, and I’m the new member of staff employed here at Southampton purely to manage the University’s linked open data. My official title, according to HR, is a ‘Data Management Specialist’, but Chris has been referring to me as a ‘Lodmaster’, which I think sounds far cooler. I used to work in ECS as a research fellow and did my PhD with Wendy Hall as my supervisor. I’m a lifelogger, and if you want some of my less thought-out comments, I can sometimes be found on Twitter as @DrAshSmith.
Apart from me, there are a few other additions to the site this week. Firstly, as users of the now-deprecated ECS EPrints system should be aware, the University has a central EPrints repository. So we now have a new regularly updated data set which maps users of the old system (and their papers) to the new system. The raw data is a massive list of owl:sameAs triples. On the subject of owl:sameAs, a new unofficial app that uses our data has been added to the Apps page of the site. SameAs.org is a service for finding equivalent URIs, and we now have a custom version of this service which looks for equivalent URIs according to our data only.
Easting & Northing
June 12, 2012
by Christopher Gutteridge
We’ve added a new dataset which adds Ordnance Survey style Easting and Northing data to everything which currently has a latitude and longitude (but only for items for which we are authoritative – University Buildings but not Bus-stops, basically.
If you get data from, say, http://data.southampton.ac.uk/building/59.rdf it now has Easting and Northing data in. I nicked the pattern from Ordinance Survey Postcode data documents.
Maybe this is useful, let us know if it is.
See the post on the Webteam Blog for the nitty gritty about how this works.
Updates and Automations
September 26, 2011
by Christopher Gutteridge
Org Updated
The “Org” dataset has been updated with data provided by our HR department on the new university structure, and the proper codes for everything. Where possible we’re using the two character alpha code (eg. FP for ECS) in the URI, but for the lower levels we’re using the full 10 charater code from the HR database, (eg. F7FP090000 for Web & Internet Science). This provides canonical IDs for all parts of the university, which is nice.
You can view the top levels on the organisation page. However, it now goes much deeper so I’ve added an option to let you view the entire org. tree.
Over the summer we’ve also added data on
- The location of student offices for each Faculty
- The location of the “deanery’ for each Faculty (although these usually are an entire floor, and our system doesn’t really do much with the concept of floors, yet)
- For faculties which have provided the data, a list of the buildings they ‘occupy’ (defined as controlling space in, rather than just having a member in that building). This has been provided by some faculties at the faculty level, and others at the Academic Unit level. We are happy to accept either. If we could complete this dataset it would be a very powerful resource.
- Where we can, we’ve added the homepage for that part of the University. We’ve not done this below the top two levels, but adding the data is very easy if people want it.
The spreadsheet in the get-the-data box on the organisation page is slightly unsual as I’ve set it to collect data we don’t show in the page. In addition to the URIs for the org. element and it’s parent element, and the label, it also includes a field for the code (FP or P2 or F5AF010000) — I figure that might be really useful for admin staff.
Update policy:
- Names of org. elements: This data belongs to HR and corrections should be sent to them. If they accpet it then I’ll update our data (please copy me the acceptance). Later, we’ll automatically source this data direct from their database.
- URLs for org. elements: data.southampton currently own this dataset, so it’s very easy to update. Just send us the correction to opendata@soton.ac.uk — I don’t anticipate much confusion so anyone is welcome to send us these.
- Space Occupied by org. element — This must be sent to us by an official admin for the group, unit or faculty concerned. If it’s a list for lots of org. elements, such as every group in a faculty, please get in tocuh as opendata@soton.ac.uk so we can send you a template spreadsheet to save us having to translate into the codes we use.
EPrints Automated
I should have done this ages ago, but the job got lost down the back of a sofa.
Every Sunday morning the EPrints datasets are now refreshed from the live archives.
Quick Sunday Update
July 17, 2011
by Christopher Gutteridge
First of all, I’ve also just added a new post over at the web team blog which might be interesting to our readers on the data blog, if you’ve ever been confused about the relationship between Open Data, Linked Data and RDF Data.
Secondly, I’ve just added in the sameAs links between our bus-stop data and data.gov.uk. I should have done this months ago, but kept forgetting. It’s up now and I imagine Hugh Glaser will import them into the sameAs.org service which will allow you to discover our data on Southampton bus-stops by resolving the government ID for a bus-stop in sameas.org (maybe we’ll link to a demo, as I don’t think I explained that very well!)
** UPDATE **: Turns out my sameAs links were wrong, but Colin has created a full set which also links our codes for train stations and I’ve added in the airport. I’ve published it as a separate linkset.
Lastly, I asked a few keys staff for comments about the value of Open Data, and here’s a great one:
The Open Day map, based on open data, amazed so many of our visitors, is was great example of how our leading edge research has translated into a very real an practical application, second only to Soton Bus!
— University of Southampton Pro Vice-Chancellor Education, Professor Debra Humphris
The open days pages aren’t actually linked from the data.southampton homepage; but they aren’t secret, just only valuable for the period of the now-passed event.
Bus Route Updates
July 13, 2011
by Christopher Gutteridge
The Southampton ROMANSE project has given us the go-ahead to put the Southampton bus times data under the OGL (Open Government License).
In celebration, I’ve added a new bus routes page to better navigate this data.
If you look deep in the data, sometimes the data identifies the exact vehicle which is coming.
I admit the RDF is shonky, is anybody working on an ontology about that should get in touch!
Generating Open Geographic Data
June 23, 2011
by Colin R Williams
Let me introduce Colin Williams, a postgraduate student who has been doing lots of interesting stuff to help the Open Data service. I’ve asked him to contribute to this blog. Over to you Colin…
*****
Recently, I have been assisting the data.southampton.ac.uk team in gathering geographic data for their site. By geographic data, I am referring to the latitude and longitude of campus buildings and services.
This can be a simple point reference, as in:
<http://id.southampton.ac.uk/point-of-service/sculpture-hepworth-1968> geo:lat 50.935436
<http://id.southampton.ac.uk/point-of-service/sculpture-hepworth-1968> geo:long -1.398055
or it could be an outline of a building (or site) footprint, as in:
<http://id.southampton.ac.uk/building/32> dct:spatial “POLYGON((-1.3960952 50.9368069,-1.3958352 50.9368250,-1.3956962 50.9360329,-1.3959562 50.9360148,-1.3960952 50.9368069))”
One of the surprising discoveries made by the data.southampton.ac.uk team during their data gathering was the lack of any geographic data held by Estates and Facilities. So, I set out to gather this data… [Editors Note: Our Estates & Facilities service do have all the geo data they need, but it’s not very useful to the open data project as they just don’t need a reference lat/long point.]
Google Maps
First stop, Google Maps. Google allows users to create their own maps, by overlaying points and polygons on their maps (or their satellite imagery). Their tool is easy to use, using a web interface to add points (and polygons) to the map. This data can then be exported, as a .kml file, which we can easily convert to a form that can be imported into data.southampton.ac.uk.
This started off fine, until I started to think more about the licencing of the data. I had read in the past that, due to the copyright held by Google (or their mapping providers) over their map data, contributors to OpenStreetMap aren’t allowed to use Google’s data to determine the location of entities.
Time to check the Google Maps Terms of Use. Specifically, term 2.(e) states that:
2. Restrictions on Use. Unless you have received prior written authorization from Google (or, as applicable, from the provider of particular Content), you must not:
…
(e) use the Products in a manner that gives you or any other person access to mass downloads or bulk feeds of any Content, including but not limited to numerical latitude or longitude coordinates, imagery, and visible map data;
So, that rules out the use of Google as a data source.
OpenStreetMap
As its name suggests, OpenStreetMap is an open data street map, with its data being available under the CC BY-SA licence. OpenStreetMap is a great example of a collaborative, wiki-style geographic application. We could re-use their data, however, we wanted to generate authorative data, without making huge, possibly unnecessary changes to the OpenStreetMap data simply in order to achieve our goal. So, let’s look somewhere else. (I should probably contribute some of our building outlines back to OpenStreetMap when I find some time.)
Ordnance Survey
The Ordnance Survey is Great Britain’s national mapping agency, which, in recent years, has released some open products. Confusingly, they seem to have two ‘Open’ products which could be relevant to our task.
OS OpenSpace
The OS OpenSpace API, according to their website, is “free to access and lets developers create amazing web applications and online projects with Ordnance Survey maps”. Sounds good so far. Their web-mab builder allows the user to add markers and routes, and then to export a html page (with javascript) that can be put on a web site. Not exactly what we’re after, but we could probably extract the data from it. Are we allowed to?
Well, it seems that this the data used on OS OpenSpace is licensed under the ‘OS OpenData terms’, which ‘include’ the Open Government Licence.
However, the OpenSpace FAQs include this entry:
2.1 I am using OS OpenSpace to create a database of location based information. Does Ordnance Survey own this?
Yes.When you use OS OpenSpace to geocode data by adding locations or attributes to it that have been directly accessed from and/or made available by Ordnance Survey mapping data, then the resulting data is ‘derived data’, because it is derived from Ordnance Survey data.
Ordnance Survey would own such ‘derived data’, but we grant you a non-exclusive, personal licence to use it within your web application. Please refer to the definition of ‘Derived Data’ and Clause 5.4 of the OS OpenSpace Developer Agreement.
Well that’s not what we want. But, how about the data, that is under the Open Government Licence?
OS OpenData
The OS OpenData site holds a variety of geographical datasets. For example, Code-Point Open is a dataset containing the latitude and longitude of 1.7 million postcodes, whilst OS VectorMap District is a vector based map of Great Britain. Unfortunately it’s not quite detailed enough to show individual buildings, which is what we’re really after.
So, the product we’re after is OS Street View (not to be confused by a similarly named, but completely different product offered by Google).
Can we use this data? The FAQ (which is in PDF format) has this to say:
11 Am I able to reuse “derived data” created from the OS OpenData products?
Yes.The licence allows the reuse of the derived data created from any OS OpenData products for commercial and non-commercial use. For more information on terms and conditions, read the OS OpenData Licence at www.ordnancesurvey.co.uk/opendata/licence.
OK, so we have found some mapping data that we are allowed to use. Is it in an easy-to-use form? Of course not, its in raster format. In other words, it’s a bitmap image (or rather, a series of images, each covering a 5km by 5km patch of Great Britain). How can we easily extract the information we need from these images?
Merkaartor
Merkaartor describes itself as an OpenStreetMap editor for Unix, Windows and Mac OS X. It turns out that we can use it to export data rather than uploading that data to OpenStreetMap.
By default, Merkaartor has a number of data sources installed. In order to use the OS OpenData maps, we add http://os.openstreetmap.org/ as a data source, which uses the OS Street View data mentioned earlier.
All that remains to be done is to trace the shapes on the map and then export the data, as KML, which we then convert into a simple CSV file to be imported into data.southampton.ac.uk.
The data that has been generated as part of this process is available in the buildings and places dataset, and you can see it in use on the University’s open data map (which I have also been developing).
****
Thanks, Colin. I’ll just wrap this up by saying that University of Southampton Buildings & Estates will one day probably take over curation of this data, and they are aware of this work. They are happy to let us worry about it for the time being. This is fine with me as buildings don’t move much. Colin has done all of this for fun in his own time. I hope the other data.xxx.ac.uk projects are lucky enough to get some helpers like this. Be ready with a plan of how to let people help if they offer!
Oooo, data
May 27, 2011
by Christopher Gutteridge
On Wednesday I gave a well-recieved talk to the university ‘Digital Economy’ research group (a virutal group containing people from all over the university).
Yesterday I had the fun problem of lots of people getting in touch with ideas! For the next couple of months I still can’t put my full focus on the Open Data, but here’s some of the interesting things going on behind the scenes:
- Facilities / Equipment dataset to describe our cool toys. I’ve got people interesting in contributing to this from all over the university. You can see a preview here. The idea is to help the left hand know what resources the right hand has, and who’s allowed to use them. I’ve had provisional interest in this from medical imaging, the high voltage lab, the nano cleanrooms, archaeology, civil engineering and chemistry.
- Disabled Go reports – someone pointed me at this site which has detailed reports on disabled access for 98 of our buildngs. Most of the data is too detailed to map into RDF, but what I was hoping to do is (1) just provide a link to the reports for each building from our data and /building/ pages. That alone gets far more value out of it and maybe (2) pull out the headline data, eg “has disabled loo”, “allows guidedogs”. We’ve been in touch with them and it sounds like they are pretty postitive about the idea. I still need their permission to provide that information under OGL or another open license.
- Catering have updated all the menus to include coffee & other hot drinks (it was missing before), after noticing the the opendatamap didn’t have any results for searching for ‘coffee’ (the horror). Problem is, the menu says “Filter (Large)” now so still no match for coffee! We’ll either rename it to “Filter Coffee (Large)” or consider adding a “Hidden Labels” field to help searches.
I got asked what the success criteria for the Open Data project was. This is very difficult to define but for me it will be when the open-data-service is so much part of business-as-usual that people on longer want an enthusiastic hacker running it! I’m looking forward to talking about the good ‘ole days when open data was a new frontier and nobody even had an ontology for coffee types or bus timetables yet.
The Open Data is starting to get put to use to:
- People are using the bus times pages (I need to make the interface better, I know!)
- Our upcoming campus mobile phone app will use some of the location data
- I’ve been asked how the service could aid with student induction– eg. help people find what’s available, and where it is.
The other thing ticking along is getting live hookups to databases. Right now it’s all done with one-off dumps, we want to be showing the living data. The dump-and-email approach is fine for getting started but now it’s time to do the far less glamorous job of making the back-end more automated. I’m still working on getting energy use data per building, and I’ve a lead on recycling data!
Good times.
One final thing, you may notice that the Open Data Map is now not quite as pretty, there’s a good reason for this. We noticed that we may not own data traced using the Google Maps, so Colin has re-created all the data from the ordnance survey instead. There is slightly less detail, but the functionality is all still there.
The slides from my talk are available on EdShare. I’ve never uploaded to EdShare before — they’ve done a really great job at making a streamlined submit process. It’s far better than anything I’ve used in EPrints before, and I say this as the person who designed the EPrints 3.0 submit workflow!