Vanissa Wanick’s doctoral research investigates the design of advergames that could influence and embed cross-cultural consumer behaviour, analysing aspects of pervasive games, HCI and advertising, particularly through the comparison between UK and Brazil. In this post, she presents her recent experience at the first day of the Research Methods Festival and describes the best practices of research that are being used in different academic studies.
Arts, design and social sciences: how to innovate in research methods
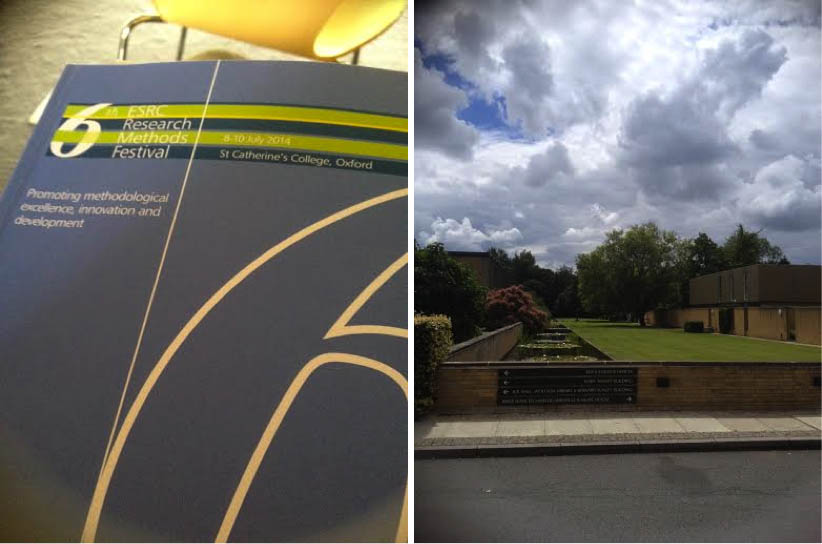
This year’s Research Methods Festival (RMF14), organized by ESRC, had intriguing and variable sessions, including talks about Cross-National Research, Visual Methods and Big Data. I had the opportunity to go for the first day of the Festival with the aim to understand better the application of cross-cultural methods and other aspects that could be helpful for my methodology section in my research. Curiously, I had very good surprises, which I hope to share here with you.

Busy morning registering many of 700 delegates at #RMF14 – I’m supplying that now basic human need: WiFi! 🙂 pic.twitter.com/Ylr31W1L4W
— Emma Norris (@EJ_Norris) July 8, 2014
Cross-National Research and the challenge of meaningful quantitative data and indicators
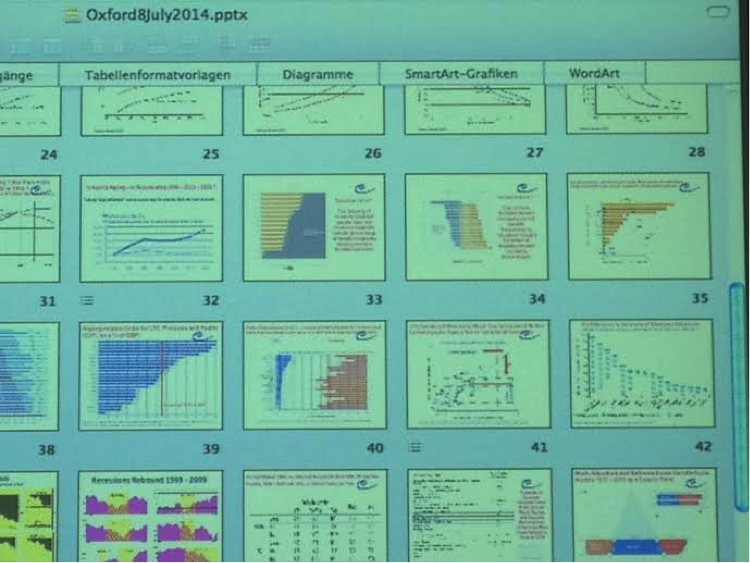
For Cross-National Research, the session offered presentations from international organizations, such as UNECE and European Commission. The discussion was mainly situated in quantitative data, international policy frameworks, monitoring tools and comparisons between countries. Basically, from the perspective of my research, the session was helpful in many ways, especially to understand how big international institutions collect their data and publish their reports. Most of the organizations gather data from institutes like World Bank, WHO, ILO and Gallup World View.
The day started with Vitalia Gaucaite, from UNECE, the main aspect presented by her was regarding frameworks like, for example the Millennium Development Goals (MDG) and the concern to make data accessible to the public and to decision-makers. The biggest challenge for most of the presenters was related to data accessibility, data quality, “time lag” (when the data was collected) and the necessity to negotiate the methodology to be applied in their research.
Most of the talks were regarding issues of ageing, unemployment and poverty, which are worldwide issues. For example, Jane Scobie from HelpAge International presented the indicators utilized to build the report “Global Age Watch Index 2013”. In essence, this shows that for any Cross-National Research it’s necessary to have indicators to build comparisons. However, defining indicators is not enough. It’s also essential to understand people’s perceptions in each country. In addition, another important aspect highlighted by the presenters was the concept that the research will always depend on how you look at things. Basically everything could be considered as relative data and it will depend on how we, as researchers, interpret it.

Finally, the session ended with Isabelle Maquet-Engsted, from the European Commission with an exciting talk about poverty and challenges of quantitative data. Again, it was mentioned that the perception of poverty could be different across cultures. For example, some countries think that poverty is related to jobless, while other countries believe that it is related to the materially deprived. In essence, the session of Cross-National Research was very helpful in order to understand the impacts of quantitative data and the variables that we should take in account.
Social media and censorship

Still during the day, I had the opportunity to watch the exciting talk from Gary King, about “Reverse Engineering of Chinese Censorship”. Gary introduced a very good background about the use of social media in research, especially regarding the popular Big Data. However the main issue was overlooking the context of the data. After building a program that could analyse this database, it was possible to understand how censorship works in China and what kind of information is not allowed in the country. It was also possible to detect the events that were censored and why. From the research perspective, Gary presented two approaches that he took with his team: observational study and experimental + participant approach. This methodology was very insightful in order to demonstrate the integration of two methods utilizing social media in one country. For this, it was necessary to have a big team with people that could not only understand Chinese as a language, but also as a culture.
Using visual methods in research

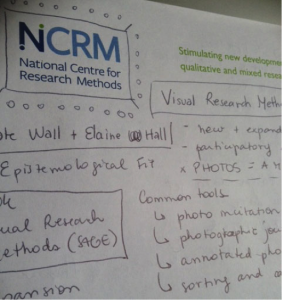
Lastly, the day ended with Visual Research Methods , which surprised me (in a good way). Visual methods are a new and expanding are of study in research methods, which could also include participatory approaches through visual resources as, for example, photos. Yes! Photos are a moment in time. They could be photo incitation, photographic journalist, annotated photographs and so on. Also, there are other methods that could be included in this category, such as cartoons (scaffolding responses), concept maps, visual organization, animation (as a learning journey), building things with LEGO (model identity) and more. I keep thinking that we could add games into that list too! Also, it’s important to understand that there are at least three types of visual data to be utilized: researcher created, researcher generated and researcher found. Briefly, visual methods can help to start conversations with people and should include confidence, understanding and warrant, making the participant interested and engaged into the study.
Finally, digital arts and social sciences at the same place
And what about adding digital arts and social sciences? That’s a talk that I’ve missed, because it was at the same time of Cross-National Research. However, I had the opportunity to enter into the website of MIDAS and find more about their project. In essence, MIDAS is an interdisciplinary methodology that combines body (physical interactions), digital resources and methods (practices and applications from social sciences). If you are interested, read this paper that explains how they mixed the methods in order to promote the best approach into research. If you are intrigued, just look at the tweet below. Imagine what we can do!
A virtual roller coaster ride using the Oculus Rift headset at the Smart Cities Exhibition #RMF14 pic.twitter.com/hPzdQZjNkU
— MIDAS (@MIDAS_LKL) July 9, 2014
Pigeon Sim – an interactive fly-through of London at the Smart Cities Exhibition #RMF14pic.twitter.com/kLrzAcqsmE
— MIDAS (@MIDAS_LKL) July 9, 2014
To conclude, my experience at the RMF14 was fantastic. The lesson that I can take from it it’s that we can and we should innovate as researchers in our studies. It’s possible to be creative and use everything we have now. Why not? There is a lot of work to do. But the best thing is that it was good to see that there is a lot of potential in research through the integration of arts and design into social sciences studies. Time to be creative!
References:
Margolis, E., & Pauwels, L. (Eds.). (2011). The Sage handbook of visual research methods. Sage.
Wall, Kate, Elaine Hall, and Pamela Woolner. “Visual methodology: previously, now and in the future.” International Journal of Research & Method in Education35.3 (2012): 223-226.
King, G., Pan, J., & Roberts, M. E. (2013). How censorship in China allows government criticism but silences collective expression. American Political Science Review, 107(02), 326-343.
Xambó, A., Jewitt, C. and Price, S. (2014) Towards an integrated methodological framework for understanding embodiment in HCI. In Proceedings of the SIGCHI Conference on Human Factors in Computer Systems. ACM.
Price, S., Jewitt, C., & Brown, B. (Eds.). (2013). The SAGE handbook of digital technology research. Sage.
