Skip to content


How to flop a Jisc project

I am at day two of #dataspring and I have done a lot of talking to people about their projects. I notice a few common mistakes which I recognise from my 4 consecutive years of Jisc projects. These are not a definitive list and they wont all apply to all projects. They are mistakes I recognise from either having made them myself or having seen other projects afflicted with them. Jisc’s remit is to get tools and technology into the hands of people and there are a few ways your project might fail to do that. This is the hit parade of my top 8 mistakes not to make. They are roughly in most important first order.

Not having a web presence which will provide long term value

This is the summary of quite a few other points. If I can’t find out anything about a project a year after it happened then the project may as well not have run at all. It is all too common for projects to find themselves in this situation. Job one should be setting yourself up with a web presence and keeping a blog of your progress. As you do presentations upload them to the blog. If you do a requirements gathering exercise put the requirements documentation on the blog. When you have software to share make sure its linked from the blog. Basically if its not on the blog it didnt happen, but don’t worry putting it on the blog is easy. If you think your project isnt big enough to warrent it’s own blog why not guest post on another projects blog?

Having no users

This is another umbrella which covers some of my other points. Without users your project isn’t a solution. The aim is solve a problem for people, without the people there is no problem. Ideally you will have users as the first deliverable. Hopefully you knew what the users problem was early enough in the bid process. Engage the users, gather their requirements, listen to their woes, solve their problems! Don’t just write a project for a jolly, that is not a good use of tax-payer money.

Thinking Jisc care about what you said in the bid

What you bid to do matters a bit… If you said you were going to build the Taj Mahal but you end up building an out house then that might look like a fail. However if you had a lot of discussions with the users and it turned out they didn’t need the Taj Mahal they just needed somewhere to flush their news paper then please don’t build a Taj Mahal just because you said you would. Jisc cares far more about the thing you build being useful to people than they do about what you said you were going to do. The thing you build should address the problem you have. If your understanding of the problem changes the solution probably will too. Chris suggests the issue maybe caused by people are used to research funding where you document a failure rather than change the criteria.

Not having the staff in post

In the old days of Jisc there was were a lot of big long projects where Universities hired someone specifically to do the project. Even as Jisc projects got shorter it was not uncommon to get an extra hand in to do the project. This gives you a number of problems. Talent is not kept in the public sector because when the project ends the staff leave. This also one of the big causes of projects lateness because either you really struggled to hire someone or the person you hired at short notice wasn’t very good. My advice is if you don’t have time to in your organisation to do the work then consider teaming up with an organisation who does or simply accepting this is not the bid for you.

Thinking it is a research project

Jisc projects are about technology, tools and infrastructure and that this is an IT concern. The research element is “will we be able to get users to use it”. The Jisc funding style attracts early career researchers who use Jisc as a leg up into the world of research. This isn’t a big problem as long as you solve the problem you aim to solve. Research papers are nowhere near as valuable to Jisc as good project website and a well documented version controlled code-base that people can reuse. If you get research done on the side that’s fine but remember to do what you bid for.

Your early deliverables have no long term value

This is becoming more of an issue now Jisc are funding projects in stages, but even when they are funding the whole project upfront. If you aren’t in the mind set of delivering long term value by the 3 month mark there is a very good chance you never will be. I always think “If this project ended tomorrow would it have been worth starting”. If the answer is “No.” look at how to change that. Get some value on the web as soon as you can, your project will be better for it.

Thinking it’s all about the software

Jisc is software, tools and infrastructure oriented and so some people get carried away. Jisc is about IT not computer science and IT is about using technology to aid a person doing a job. The greatest piece of software in the world is nothing without users. Users are great for finding emergent properties of the software, providing ideas and finding bugs. Get some users, and work really hard to keep them engaged. Also make sure you are promoting your projects in the right places. Some projects dont have software outputs but they should still have users. Recommendations that no one has ever followed are a bum deal too. (See also Having no users)

Writing other unfinished projects into the bid

This is not the most import point but worth considering. If in your project bid you have software or services which are not released yet then assume they wont be. They may well not be within the life of your project. I know a few projects where the whole project was built on the outputs of other Jisc projects. A lot of the outputs turned out to be poor or were not finished before the project started. This made the project massively behind schedule and a lot of time was spent cleaning up other peoples mess.

Posted in Uncategorized.


What makes it a service?

A question which I have been putting a lot of thought into recently is “What makes a service?” Adam Field leaving team has really solidified some of my thinking on the subject. I present the case study example of micro data repositories which are repositories we provide to researchers for storing bespoke datasets. Adam had been running this “service” for around about 9 months and it is starting to prove quite popular. It was only when he came to pass management of it on to me that we realised there were quite a few things missing. Adam was a smart member of the team who had been competently doing his job and meeting customer expectations but for this to truly be a “service” someone other than him had to be able to do that work.

Because Adam is competent he was already doing some good practice which makes life a lot easier for him and other maintainers to follow. He was using a standard software platform, in this case EPrints, and he was keeping his EPrints configuration and customisations very distinctly separate from the main EPrints configuration. This meant it was easy to see what code required maintenance and of course all the bespoke code was version controlled using git. However this didn’t leave me with much clue of what the various repositories on the service did or how I would know to issue a new one.

The first thing he did is put together some documentation for me. This explained what the platform was for, how it worked and what instances were running to date. This meant that I knew what I would soon be managing. However when I reviewed the documentation I realised it had a large section dedicated to “How to be a competent person like me doing my job” which undoubtedly would suffice, assuming I am competent.

What I noticed was that certain parts of the process were roughly the same each time. For his own sanity Adam had created a set of conventions in how configuration was managed and version controlled. I suggested to Adam that he created a script to automate the repeatable parts of the process. He did this and as he did he tidied and formalised some of the parts of the process to make it more rigidly defined. Each micro data repository still has bespoke configuration (that’s what keeps us in work) but now handle cranking parts of the process can be done with couple of simple commands.

The result of Adam’s work is that I could pick up maintenance and expansion of the service without too much conferring with Adam. Part of my role maintaining the system is to keep the documentation up to date and add scripts to automate the process as I feel it is appropriate. So in conclusion the differences between a “competent person doing their job well” and a “service” are:

  • A service has its custom configuration clearly separated from its code
  • A service has clear and concise documentation, including a definition of how it delivers value to the user (nod to ITIL)
  • A service has scripts or other tools so that it requires as little effort as possible to maintain

The result of all this extra work is that other people can easily pick up and maintain a service without it being their full time job. There is no guessing about how its supposed to work or when it is the right tool for the job. A service runs itself like clock work.

Posted in Uncategorized.


What would an independent Scotland mean for UK open data?


British Isles Euler diagram [CC0 by TWCarlson, via Wikipedia]

I’m posing the question because it looks like a reality we may all be dealing with very soon.

My preference would be for Scotland to vote no to leaving the UK [views my own, not my employer], but that’s not my decision to make.

So, I’m just trying to get my thoughts in order on what the implications might be. Please feel free to chip in if I’ve missed things, or you think I’ve been overly persimistic or optimistic.

Mergers and splits are always a time consuming data management job. For example, when we reorganised the research groups in the Electronics & Computer Science department there were some tricky decisions to make. We list the publications of a research group on it’s website. When groups split and merge, we either have to start from scratch or decide what group to assign each paper to. Last time we waited until all the new group memberships were settled then wrote a script to reassign papers to groups based on the memberships of the authors. That’s a storm in a teacup compared with splitting a country into two.

Domains: When .uk is no longer accurate.

My best guess is that, if Scotland leaves the union, it will have a new top-level domain, but that many cross-border businesses and organisation will use .uk for years into the future. There does appear to be a .scot domain, but I suspect it will take some time to move sites like www.ed.ac.uk to www.ed.ac.scot, and it seems likely they’d just redirect their .ac.uk domains.

Not many Scottish universities have done much with linked data yet, so the issues of organisation-assigned URIs isn’t so likely to raise its ugly head this time, but it does lead to questions about data.ac.uk. What should we do with http://id.learning-provider.data.ac.uk/ukprn/10007790  — should a UK organisation be defining .uk URIs for a .scot institution.

HESA & UCAS

HESA are the UK higher education statistics agency and UCAS are the organisation that allows UK students to apply for University.

One of the big advantages of HESA is that they allow us to compare data (open and otherwise) between UK universities. Data returns to HESA are mandatory, but sadly they are not funded in a way that allows them to make the majority of their data open and available to all. I would hate to see HESA and UCAS fragmented, it wouldn’t benefit the students in any way I can see.

Russell Group, Universities UK etc.

The UK has a number of university consortia. Which is to say clubs to which university’s belong. The University of Southampton is part of the Russell Group, which includes Glasgow & Edinburgh. In the short term, there’s little value in breaking up these consortia over state lines, but one of the reasons they exist is to provide a collective voice to government and to address strategic responses to government policy. As the research & education policies diverge these may become less meaningful.

Ordnance Survey

The Ordance Survey is more-or-less the UK mapping organistation. It’s based in Southampton so I’ve a number of friends who work there. Said friends are rightfully proud of the work OS does.

The more-or-less I mentioned is that the OS handles Great Britain, so Scotland, England, Wales but not Northern Ireland. NI is covered by a separate mapping organisation, so things are already no restricted to state lines.

The OS does have open data and URIs: http://data.ordnancesurvey.co.uk/id/postcodeunit/SO173AG and that could be tricky for scottish data with .uk URIs.

data.gov.uk

I think that the UK government open data site is one of the more likely to be split early. As it’s primarily a repository rather than a service, I think you could do this with less trauma than with services or APIs.

That said, there’s no rush, and it would be helpful for agencies both sides of the border to collect data with the same approaches so that they can still be meaningfully compared and used by apps which work either side of the border.

What to do?

Maybe minting URIs by state is not going to work in the long term. States do occasionally merge and split. I have no idea what a better solution might be. Cool URIs don’t change, but what are you to do when your URI is suddenly unpatriotic?

I think that if Scotland votes to leave the UK, then there’s not hurry to address the issues of cross-border data and cross-border agencies. Public sector open data is something for which the UK has been a world-leader. Obviously there’s many bigger questions about what the future might hold for the British Isles, but whatever happens, please don’t rush to split services, websites and datasets. Slow and steady.

What did I miss? What’s the best plan for national open data when a nation divides?

Posted in Best Practice.

Tagged with .


ServiceLine Testing: A Diversion from Development

Within the first couple of days of my internship a lady entered the office I work in and seemed excited by the prospect of an intern – and thus I was recruited into the testing of a product called ServiceNow. ServiceNow is a system for the reporting and management of issues, requests and the like within the university. The section I was specifically testing was the interface for students to report issues, and monitor their progress.

So I arrived at the test suite at 9am and was provided with an .xlsm file detailing the specific tasks I was to run through alongside their expected outcome. Alongside these were a couple of columns for me to enter into – most importantly were the ‘Pass/Fail’ and ‘Actual Result’ columns.

The first few tasks were your run-of-the-mill questions evaluating the initial experience: ‘You can log in and are taken to the Landing Page’ (rather important), ‘The logo and branding match the University of Southampton branding’, ‘Options X, Y and Z are available in the navigation menu’ etc.

Then the more in-depth testing came: There were three main departments tickets could be submitted to – Finance, HR and IT. I was provided with an (almost identical) list of tasks for each to run through, attempting to submit tickets through all available options and seeing what would break. There were some issues here and there – generally everything went very smoothly for the HR section, though there were some difficulties with the other two. Everything seemed fine from the front end, but things were hanging up on the back-end (being sat next to someone who was monitoring the system made analysing this significantly easier). I should imagine this won’t be too difficult to remedy as the three department’s tickets were almost identical, so if one works fine then it should be easy to compare to the others to determine the issue.

There were a few other issues present – an occasional dead link, missing information and the likes. Overall though, the system seemed to hold up well – it has things to be fixed, of course, but that’s the whole purpose of testing it.

This’ll be left as the rather short post that it is – the Open Badges project is reaching a potential climax, however, so I’ll hopefully have a lot to write about very soon.

Posted in testing, Uncategorized.


Parson’s Problems

Learning programming is tough. I teach on COMP1202, Programming 1 for computer science and we are always looking for ways to smooth out the learning experience. The course assumes absolutely no programming knowledge and is taught using lectures, practical classes (called labs) and optional tutorial sessions. Having designed the labs for several different introductory programming courses there is recurring problem. The problem of week 1. At this point in the course if you are lucky students will have had 2 lectures and much of the first one will have been a “house keeping” style introduction. This makes writing a lab hugely challenging. You could just skip a lab in week one but the course has a practical focus so we want students getting there hands dirty as quickly as possible. Something we will be exploring this year in lab 1 is introducing programming using Parson’s Problems.

A Parson’s Problem is essentially a code rearrangement task. You give students all the code they need to solve the problem but you jumble up the lines. The program can be fairly simple (does not even have to use iteration) but still reinforces the importance of syntactic structure of the programming language. It also forces students to think about the algorithmic steps of solving the problem without having to worry about getting every tiny bit of syntax correct. This makes the learning outcomes of the exercise quite high level which is hard to do in week one.

The problem I found is that there are very few examples of Parson’s Problems floating around on the web. I concluded that the best way to make one was to write a simple program which does what you want and then jumble it up. There is an added subtly that white space at the beginning of the line gives away what nesting level in the code the line should appear so, to make it a trickier, leading white space is removed. This job was now a big enough task that it was worth writing a program to solve it. I chose perl because its a string manipulation task but you could have written it in anything. The following can be run on any source code file to turn it into a Parsons problem. For teaching I recommend only do this with simple programs since it gets tricky very fast. I amused myself by testing the program by running it on itself to create a Parson’s problem which once solved creates Parson’s problems.

#!/usr/bin/perl
use List::Util qw(shuffle);

if(scalar @ARGV > 1)
{
    print "Usage:
    parsons.pl ";
    exit;
}
open($fh,$ARGV[0]);

@lines = <$fh>;

@output = shuffle(@lines);

foreach $line (@output)
{
    $line =~ s/^\s*//;
    if(length $line > 0)
    {
        print $line, "\n";
    }
}

Posted in Perl, Programming, Training.


rss.data.ac.uk v2: Frameworks, Refactorisation and Documentation

UntitledI’m quite a few weeks into my internship now, and have been working with PHP for a while now (I fear it’s very much becoming the Devil I know) – so it seemed like a prime time to go back and refactor the code behind rss.data.ac.uk, as well as implement a few extra features.

So the first thing was to refactor the back-end – shatter my_first_code.php into some (vaguely) sensible classes. My method to do this was as such:

  • Have my old code up on one screen, a fresh terminal up on the other.
  • Slowly copy things across – making changes, fixing errors and creating classes where necessary.
  • Make tea.
  • Repeat.

After a couple of hours the basic refactoring was done, and so it was time to implement some actual changes (improvements, some might say).

The main improvement made to the back-end was a more robust implementation for inserting institutions, feeds and posts into the database. Two different methods were used – one for institutions (because of their relatively simple nature), and one for both feeds and posts:

  • Institutions came with relatively little meta-data about them (ID, Name, Groups and PDomain), and so could be placed into the database with a simple INSERT IGNORE – if the PDomain was already present then the entry was ignored, if it was not it would be inserted (Name and Group handling comes later).
  • Feeds and posts were a little more fiddly – they couldn’t be based purely off of the URL, like institutions, as these were often re-used and so an INSERT IGNORE would fail to update any relevant meta-data. The solution used was to make a hash of the feed/post title and its related URL. Before attempting to insert a feed/post, the database would be queried for any entries which matched the URL of the item to be inserted, and then return the stored title/URL hash. If no entries were returned, then this was a completely new feed/post and so could safely be put in with an INSERT IGNORE. If an entry was returned then the hash would be checked against a hash of the title/URL of the item to be inserted – if they were equal (we could safely assume that) nothing had changed, and so the insert attempt would be abandoned. If they were different, however, then the URL was the same but the title had changed – the URL had been repurposed, and so an UPDATE statement was used.

Aside from this more robust insertion method, the main change was to tie in meta-data to the institutions (a database ID/URL pair don’t really say much about a place). data.ac.uk stored such meta-data, and so it was a simple matter of writing a script to download the data, compare the URLs of the downloaded data to those in the database, and update the Name/Groups columns of the table wherever the URLs matched.

The web-facing end of rss.data.ac.uk was then sanitised by placing it into a framework – Fat-Free PHP to be specific (our good friend from Honey Badger). This involved separating out the page into the MVC design pattern, which it definitely wasn’t beforehand. After this, there was some fiddling around with CSS to make the page look right. The ability to filter results on specific university groups (e.g. ‘The Russell Group’) was also added – through a combination of checkboxes on the homepage and multiple INNER JOINs in the database. Though using Fat-Free PHP felt difficult at first (my time with it during Honey Badger was fleeting) it really felt far more flexible than hand-writing everything by the end – which is rather good, as that’s its intended purpose and it means I’m actually starting to get a grasp of it.

After this various documentation was written for the project – namely proper commenting (partially done during the refactoring, partially after) and a README with installation instructions.

From here it was a ‘simple’ case of pushing dev to live – and fixing the inevitable torrent of problems caused by this (and updating the README so if anyone does ever implement/move this, hopefully they don’t suffer as I did):

  • Submodules not properly pulling from git with the project clone, so manually initialising and updating them.
  • Apache proving computers aren’t deterministic – restart Apache several times and you have the same issue, call over a colleague for assistance and show him (without making a single change) and it suddenly decides to work…
  • Deprecated flags in the MySQL my.cnf as the VM sneakily updated from 5.4 to 5.5.
  • The need to update MySQL (less sneakily) from 5.5.24 to 5.5.38 for a bug fix.

After this fiddling around, everything worked rather smoothly and I could go from a clone to a working website in a matter of minutes.

As this project was such a massive overhaul of the original code, it’s got its very own repository. If you feel so inclined you can find it here.

Posted in Open Data, Uncategorized.

Tagged with , , .


WAISfest: Predicting the Seasons

The GitHub, for those interested, for our WAISfest ’14 project is available here.

I spent a good portion of last week copying and pasting information from module syllabi (yes, that’s actually a real word) into something called Syllabus Editor. The specific details of this task are irrelevant, as I’m just using it as an introduction to something far more exciting. Anyway, several hours into the copy-paste wonder, Patrick promised me that the next few days would more than make up for it, as I was to be going to something called WAISfest (I’m ashamed to admit that the first time I heard it mentioned in conversation I thought I’d heard the phrase ‘Wastefest’, not quite as enticing…).

WAIS = Web And Internet Science (Research Group)

fest = festival. Though I hope you knew that part already.

So yes, WAISfest is basically a hackathon – people from within WAIS come up with a basic idea to work upon, people join whichever group sounds interesting to them, then three days later everyone presents their progress. Here has been my experience:

Day One, Thursday 31st July 2014: Wandering into the specified lecture hall at 09:30 I wasn’t entirely sure what to expect – I had been promised by Patrick that I’d have three days of over-stimulation, and the general attitude of everyone towards WAISfest seemed to be one of excitement. On entering the hall, there was a table with free tea, coffee and endless pastries. I am a student, free food is my raison d’être, we are off to a good start (Pastry Count: I).

After a brief introduction by Rikki Prince to a) what WAISfest is and b) the general plan for the coming days, people started to present their ideas. Amongst the ideas were things such as location-aware narratives, the distance at which some common websites are identifiable (or, as I like to call it, Rikki’s ‘Can people from the other side of the room tell I’m not actually working?’) and analysing images from Flickr to predict seasons. There were, of course, many more such topics, which you can read about here.

Presentations done, the leads of each group were dispersed throughout the room and the crowd unleashed upon them. As the more astute of you may have determined already, I went with the Flickr seasonal analysis choice, which was led by Dr. Jonathan Hare. Groups assigned (as it turned out, our group ended up as just Jon and myself), people dispersed and ‘work’ began – though not before stopping once more at the refreshments table (Pastry Count: II).

Jon had done some similar work at a previous WAISfest, plus had a convenient 46 million images (with their meta-data) downloaded from Flickr lying around, so we were in a good position to start working. The first steps were to determine how we were going to filter our data-set, and how we were going to analyse it. Our initial filter involved a simple grep on the meta-data, and after various trials and manual check, we decided to search upon the word ‘leaves’ – this gave us about 85,000 results.

HSV

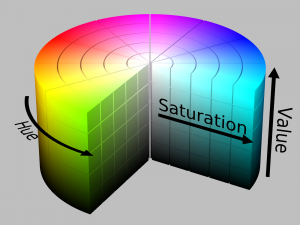
By SharkD, licensed under Creative Commons Attribution-Share Alike 3.0

To analyse the images themselves we used OpenIMAJ to perform some basic colour analysis. We interpreted colour in the images using the HSV (Hue Saturation Value) colour space, then defined certain areas of the space as green (roughly 60 to 150 degrees) red (roughly 330 to 60 degrees), or black (the rest) – low saturation and low value areas were also defined as black. Each pixel of the image was then coloured accordingly, leaving us with trichrome resulting images. Ignoring the black, we could then calculate a ‘Colour Value’ based on the ratio of green and red, using a formula (that we may have made up) based upon the Normalised Difference Vegetation Index: (Red – Green) / (Red + Green), giving us between -1 (all green) and 1 (all red).

All of the actual analysis was completed using the Hadoop framework. Hadoop MapReduce is designed for parallel processing of large amounts of data across large clusters – we had a large amount of data to be processed, and access to a cluster, so it all rather made sense. Normally MapReduce consists of, unsurprisingly, map and reduce functions – the map transforms input key/value pairs to output key/value pairs, and the reduce generates the desired output from them. However, as our analysis was rather simple, we just had a single map function that took in a list of ID and image pairs and output ID and colour value pairs.

Mid-afternoon there was a coffee break held in the rec. room, most people showed up to discuss how everyone was getting along (Pastry Count: III). After a short break, we went downstairs and back to work (Pastry Count: IV).

Day Two, Friday 1st August 2014: Jon and myself met up at 09:30 at his office and got back to work. Our MapReduce had finished the previous evening, so now it was a case of visualising it and seeing if it came out as hoped. At 12:30 there was to be a presentation session with lunch – so we wanted to ideally have something to show by then.

northern_hemisphere_result_1

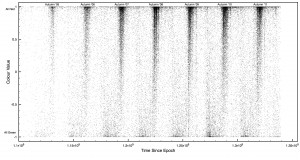
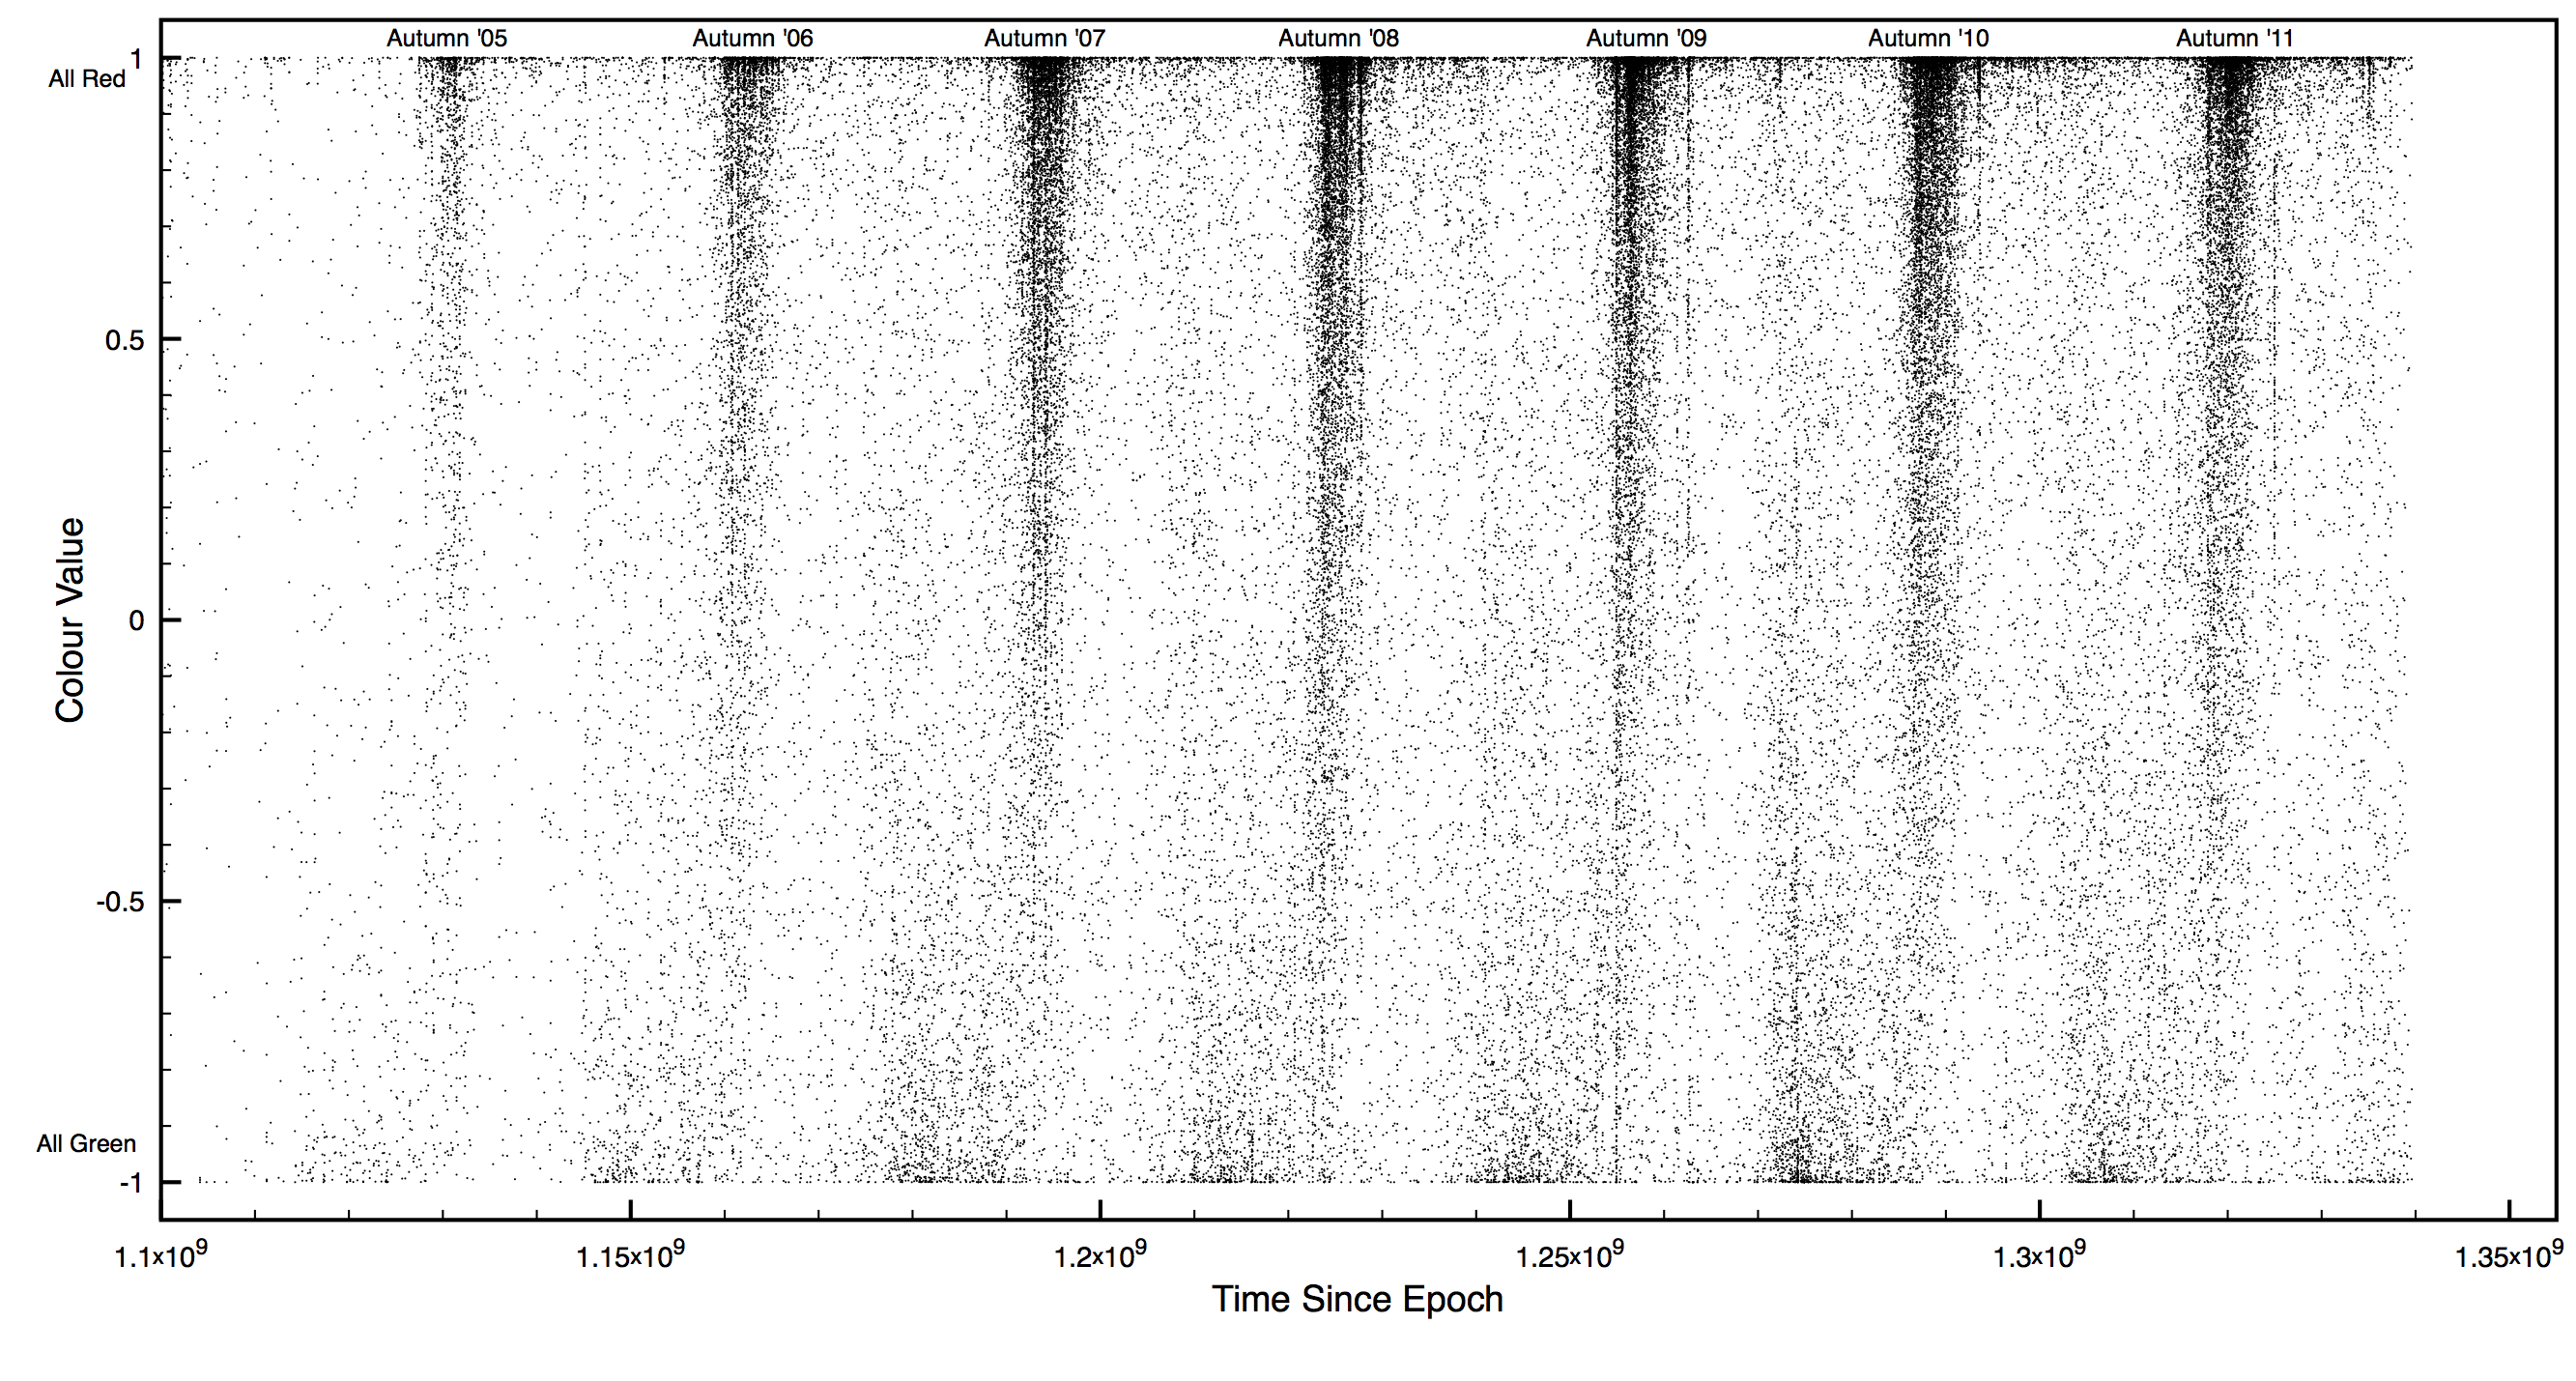
Colour Value vs. Time for the Northern Hemisphere

On looking over the data, things actually seemed to be coming out the way we wanted (I’m still always a little surprised when things come out as expected). We managed to get some basic plots (of colour value vs. time) knocked up in time for the lunch session in order to show our progress. These plots showed high clusters of red images every autumn, and smaller clusters of green every spring – the colours correlated to what we’d hoped, and it also hinted that people took more photos of trees in the autumn (which does make sense).

After lunch we got back to work (Pastry Count: V), and back to a more complicated visualisation. Using OpenIMAJ with the colour value, latitude, longitude and date of each image we created a visualisation which showed the location of each image over time, as a coloured dot. This was then overlayed onto a map of the world, to give clearer perspective. This resulted in a rather pretty display, which showed some rather interesting data: Focusing on East Coast US, as that had a huge amount of data, you could clearly see the cycle from green to red, and back, over the years. The red would also sweep down from the North each autumn, following the pattern you’d expect of seasons – our analysis (on some level) had worked.

With some initial visualisation complete, it was decided to go back and try to retrieve more data. A quick script was written up to search through the title, description and tags of the image meta-data looking for specific words (a smarter search than using grep) – we then searched for ‘leaves’ again, but this time with many foreign translations slotted in; ‘hojas’, ‘bladeren’, ‘löv’, ‘laub’, amongst others. This resulted in about 90,000 images, surprisingly few more – this may very well be a product of the demographic of Flickr. Another Hadoop MapRedudce was left to retrieve the matching images, and we left for the weekend.

images_per_month

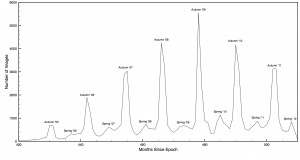
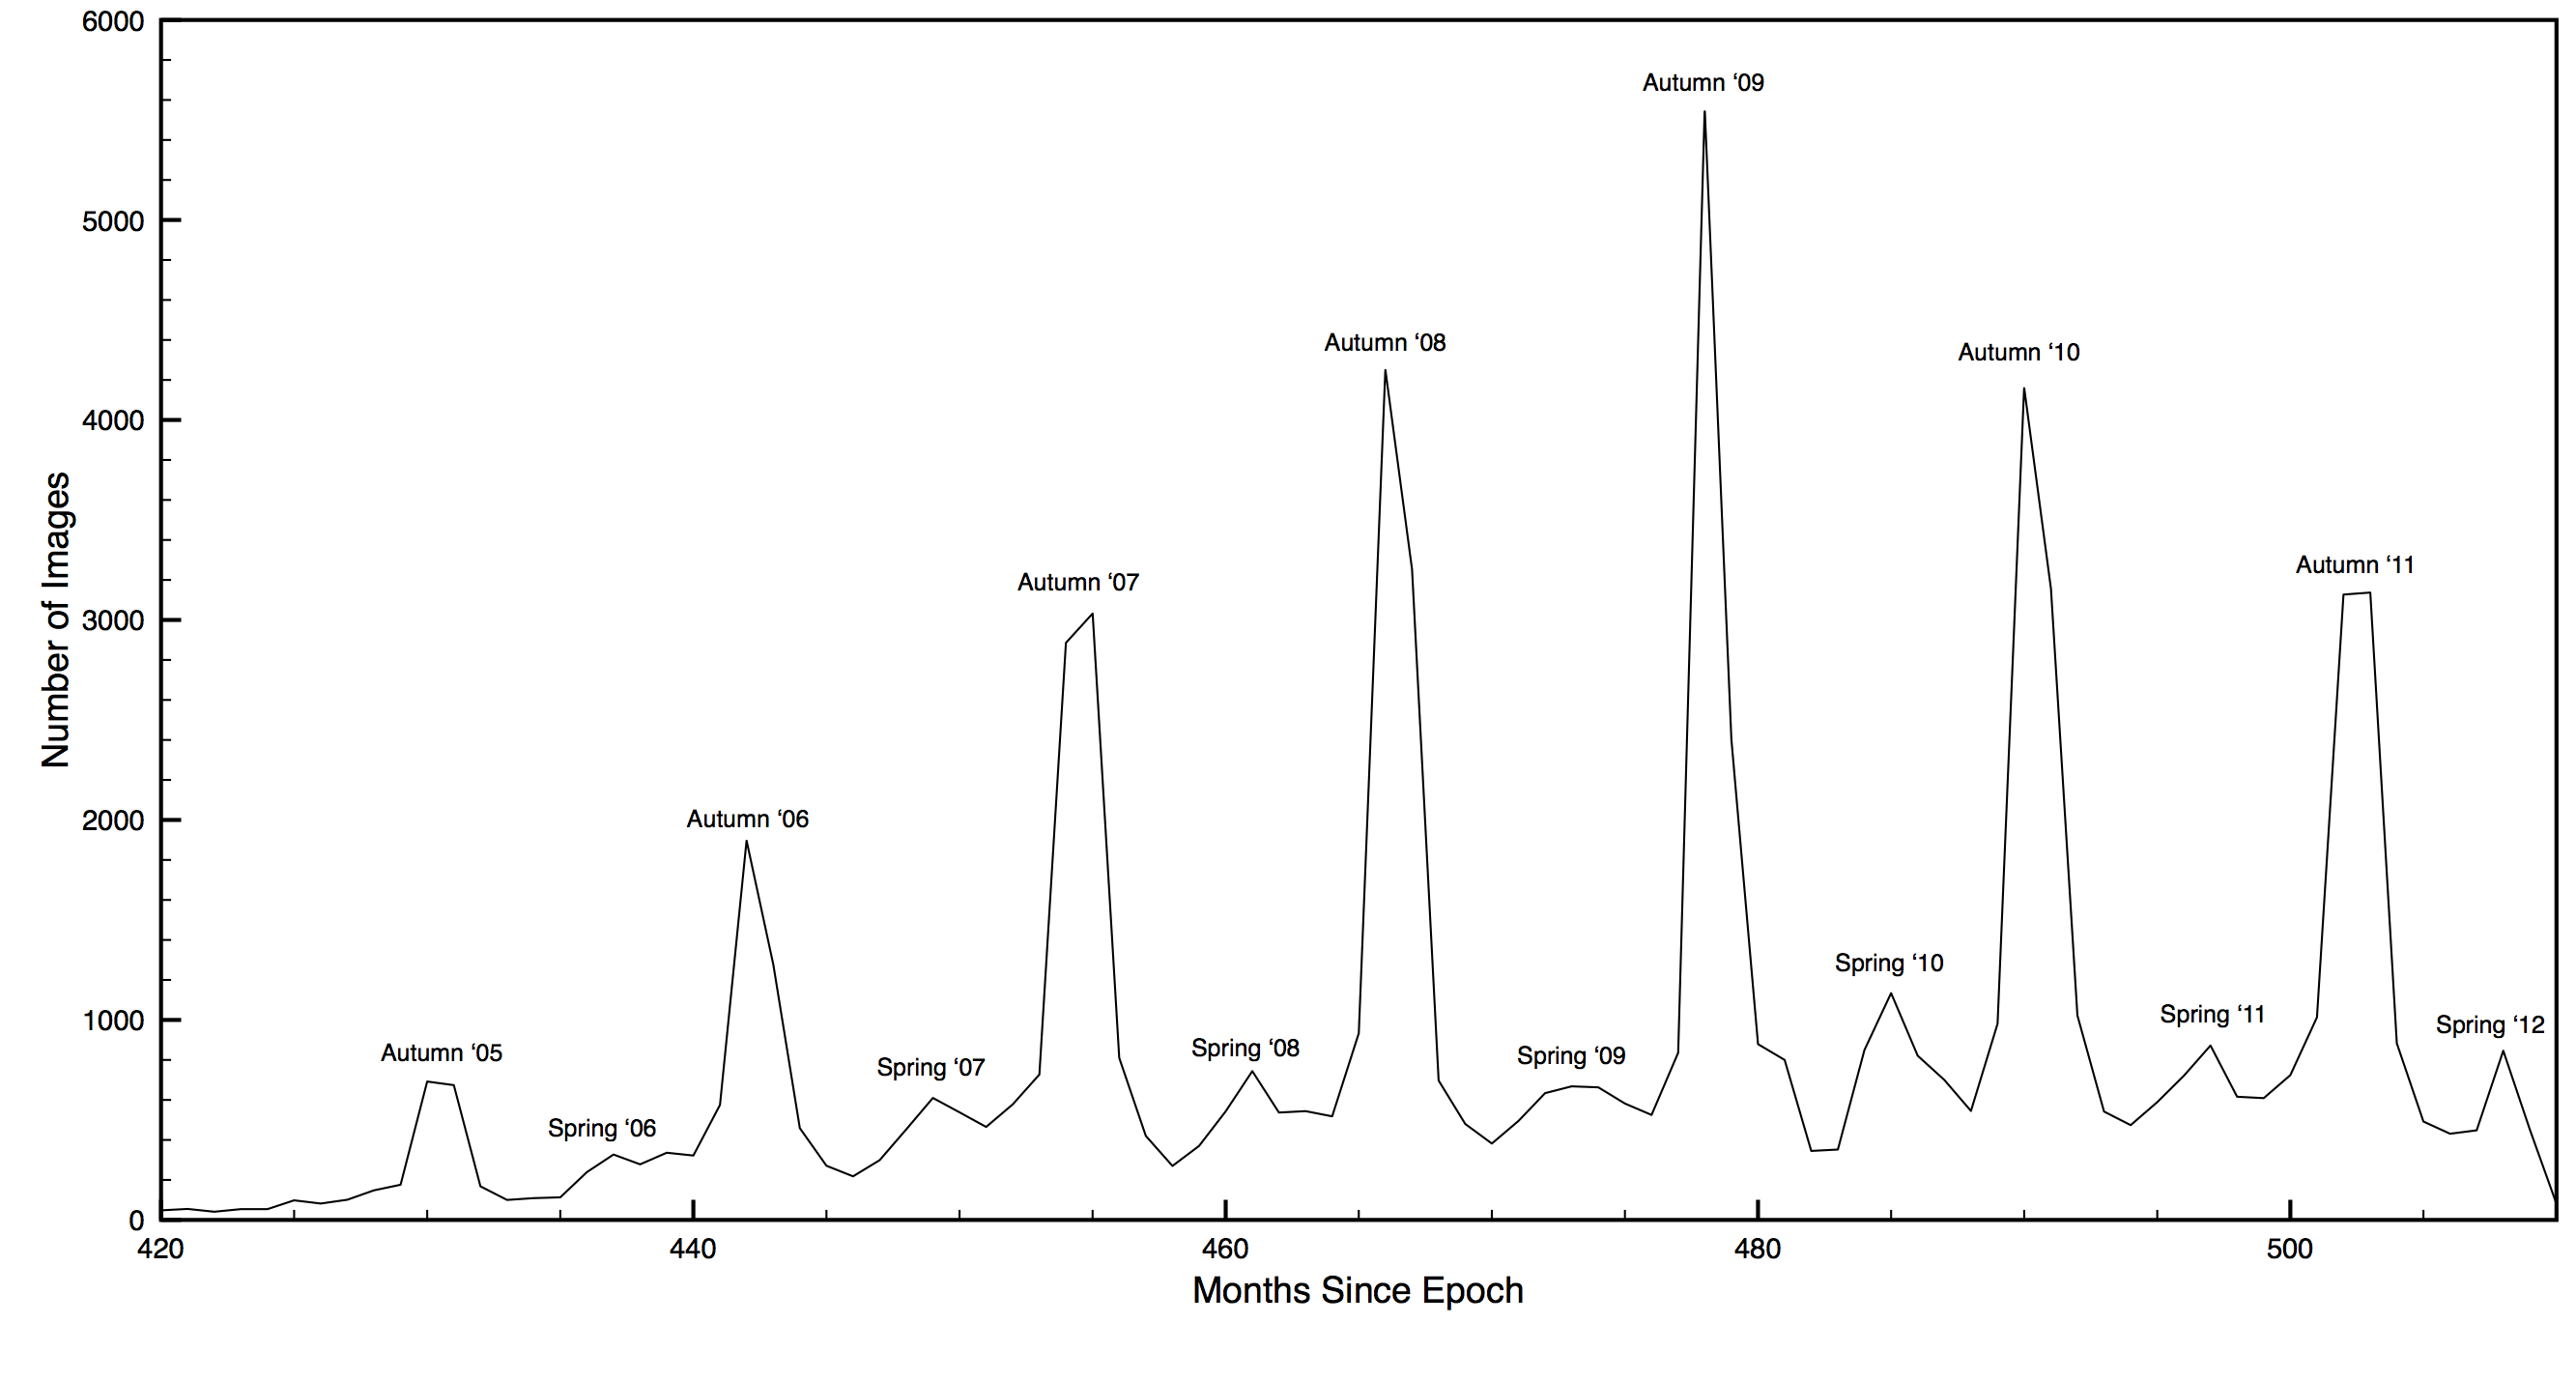
Images Taken vs. Time

Day Three, Monday 4th August 2014: The final day of WAISfest, time to bring everything together into something presentable. Before that, however, we had a few more things to do. The first of which was a comparison of our results to the NASA MODIS NDVI. The MODIS images were downloaded and greyscaled, then our data was aggregated into 16-day windows to align with them. For every point of data we had, we then analysed the corresponding location from the MODIS data to see if there was any correlation. A positive correlation was found, with a gradient of about 0.15 – not perfect, but it was there. These comparisons were then turned into another visualisation, showing the average colour of latitude-divided strips for both sets of data over time.

A final few other graphs were created, showing images taken over time (ignoring the colour index) to build upon the earlier trend found that people take more photos of leaves in the autumn. It was shown that the number of photos taken in autumn were many times greater than those in spring, the second most common time of year. Interestingly, it also showed that (from our available data of pre-2012) there were fewer images in 2010 and 2011 than there were in 2009 – whether this is indicative of less attractive autumns, a decline in popularity of Flickr, or any another reason, I am not in any position to tell. These final graphs, along with everything else created thus far, was wrapped up together in a presentation to give that afternoon. We never did include the image data from our second sweep…

Everyone gathered in the (freezing cold) lecture hall come afternoon to present their findings. I cannot begin to give a summary of all the different outcomes, but it seemed that every group had fared well, and WAISfest ’14 seemed to have been a success. Our presentation also seemed rather well received, so I cannot complain. This was followed by a gathering in the coffee room with pizza, drinks and cakes (Pastry Count: VI). Not a bad end to a pretty good few days.

Overall WAISfest ’14 was a lot of fun, and I also learnt a fair bit (I’ve been meaning to look into Hadoop for a while). It was a great event that provided something different and creative, and I hope that I’m available next year to partake again.

Apologies if some of the first links to people/events aren’t working, they’re behind the ECS login and not available elsewhere.

Posted in Events, Uncategorized.

Tagged with , , , , , , .


Honey Badger: A Mozilla Open Badges Implementation

I’ve yet to make a Honey Badger logo, so have the Mozilla Open Badges one, instead.

The idea of Mozilla Open Badges is a simple one: so that people can be given recognition for their skills and accomplishments. Each badge is encoded with various bits of information, including who was awarded the badge, for what reason, and who the issuer was. These badges can then be displayed, and interested parties can verify their authenticity with the badge issuer. If you’re interested in reading more about the Open Badges themselves, then their web-page, wiki and GitHub are all great places to look.

Now, there’s a myriad reasons why an institute such as the University of Southampton would be interested in getting involved in such a scheme:

The students:
Generally upon graduation people have an academic record and a referee in their tutor. Utilising badges people could be concretely acknowledge for their other achievements – for example, people already put their society involvements on their CV, talk about them in interviews, but it would be great if the university could provide evidenced recognition for such things. The same goes for a multitude of other similar things: being a Course Rep, helping out at the Students’ Union, being a Student Demonstrator, the list goes on.
Staff training:
It’s a fact of life that people have to undergo various bits of training, for example I had to read through various Health & Safety materials when starting my internship, and I know others have to go through computer-usage courses. There are also more interesting optional courses people might take for their professional development provided by the Universities Professional Development Unit (PDU). Badges could be used as another way of tracking such training – a single wallet displaying all the courses you’ve attended over the time of your employment history.
Others:
These are just some preliminary ideas – the actual use could be expanded out and incredibly varied. Open Badges have the potential to be a very useful tool. One thing which must be considered at a higher level in the organisation is how the creation of badges is to be governed. This must be done carefully and consistently if the badges are to remain high value for the members of staff and students who achieve them.

Reading around on implementations of Open Badges led to the discovery of ‘Badge-It Gadget Lite‘ by Achievery. This implementation was lightweight, but provided all the base functionality required – it was the perfect candidate to refactor and build upon. Our endgame, to have an MVC Open Badge issuing system to be utilised by the University of Southampton, but that could also be easily slotted into other universities’ systems.

The first step was to decide on a framework to be using – the framework of choice (namely the choice of the people who might be maintaining this once I’m gone) was Fat-Free PHP (GitHub here). FloraForm was also selected to be used for any forms that would be required.

After a while of playing around, finding my framework feet, things started to get moving. I chopped and changed ‘Badge-It Gadget Lite’ into the framework, and managed to get all of the basics working on my local machine: the ability to award and create badges. I am currently at the stage of refactoring the code thus far, while awaiting to push it to a live server. Once this is done the ability to redeem badges will be tested – this requires live as an external API has to query the website for verification.

Provided that all goes smoothly the next stage will be to test the system as a whole, clear up the unused sections of the framework, and provide some CSS to beautify the product. This will enable the core of the product to be used, should it be required, while working on future features. And what are these ‘future features’, you might ask? Well, I don’t really know, but I promise I’ll think of something.

Also yes, I still hate PHP.

Posted in Uncategorized.

Tagged with , , .


rss.data.ac.uk: A Consolidated University RSS Feed

Or ‘How I Learnt To Hate PHP‘.

rss.dataFor the first few days as an intern my time was spent shadowing various people in iSolutions and learning some of the ropes. However, it wasn’t long before I was assigned my first project: using Observatory to collate the RSS feeds from the home pages of all the UK academic institutions. Such a website would help streamline access to data that is already out there – a centralised hub to search through, generating custom RSS feeds for data of interest, rather than having to manually check various sources.

Before I go into the details, you can find the finished result here.

The rough plan was to pull the data from Observatory, parse it to retrieve the location of the RSS feeds, crawl across the feeds (dumping the relevant information into a database), create the ability to query said database, generate RSS feeds from the results, then put a nice shiny front-end on everything. The languages to be used were PHP, MySQL, HTML and CSS.

Pulling the data:
One of the first things I was told about PHP was that it has a function for absolutely everything. Absolutely. Everything. As a result this was a rather trivial task – one function to get the contents of a URL, one more to decode the returned object into JSON. It’s always nice when things start smoothly.
Parsing the JSON:
This was merely a case of checking there were values in certain bits of the arrays – plug in the key I want and see if anything comes back. If an RSS feed was there, add the relevant details to another array to be crawled over later.
Crawling the feeds:
For this task I was recommended LastRSS by Patrick – a very lightweight crawler that did all the necessary legwork. I had great success in using LastRSS, it was both very simple and very effective in its purpose. It is very forgiving of poorly formed RSS, which proved to be very useful.
Dumping to a database:
The information returned by the crawl was all inserted into a fairly simple MySQL database. In doing this I learnt a lot about using prepared statements in PHP – both making searching more efficient, and also helping to protect the underlying database against injections.
Parsing the JSON, Round II:
After running the crawl and dumping to the database it became apparent that there were some inconsistencies in the RSS feeds I was retrieving from the initial JSON data – some were full URLs, whereas some were just the suffix, e.g. ‘/rss’. A small fix was made to my initial parse – a check was done to see if the RSS URL was incomplete, if so the source URL was concatenated with the RSS URL.
Crawling/Dumping, Round II:
After this fix the crawl was run again and the data generated seemed much more complete. Excellent.
Querying the Database:
Now that everything for gathering the data was in place it was just a case of pulling out the information required. Once again, I utilised the magic that are prepared statements for this task. The ‘Post Title’ and ‘Post Description’ columns of the database were indexed, then search terms were entered into a simple LIKE query. This method returned adequate, but not ideal, results. Attempt number two was far more successful – using MATCH/AGAINST and IN NATURAL LANGUAGE MODE provided excellent results, if multiple terms were entered it would no longer just return entries containing all of them, but those containing both all and some. This also generated a ‘relevancy’ value, which the data could then be ordered on, providing the most relevant search results first (the initial query was ordered on post date). It was also necessary to make it so only results which happened in the past were returned, as some RSS posts seem to have been used to create events with future dates…
Custom RSS feeds:
Here I utilised a library called RSSWriter to create custom feeds – it was as simple as creating an object and putting the required data in. I love libraries.
Shiny front-end:
Now that all the back-end was functional, it was just a case of turning it into an actual web-page. A tiny bit of HTML writing, and CSS styling (once again from our good friend Observatory) led to a fairly presentable, and most importantly functional, product.

Overall I am happy with the current state of the product – it has some bugs to fix, and features to improve, but if I tell everyone that it’s currently in alpha then those things are expected and I’m let off the hook.

Some of the things that still need doing:

  • There were some issues with character encoding – foreign characters caused issues within the database, and I believe the current fix for this has now caused issues with HTML characters (though why people have included HTML in their RSS descriptions is beyond me).
  • The live server that the site is currently hosted on only has MySQL 5.0. IN NATURAL LANGUAGE MODE came in in MySQL 5.1. So we’re currently using the not-so-great LIKE search.
  • A cron job needs setting up so that the parse/crawl/dump is done automatically.

I have learnt a lot about RSS, PHP and MySQL in this short project, so the whole learning part of the internship seems to be going well so far.

For those interested, you can find the GitHub for the project here.

Posted in Open Data, Uncategorized.

Tagged with , , .


Interning at iSolutions

I’m Ian Barker, a Computer Science student moving into my third year, and I’m to be an intern at iSolutions over the summer – I believe my official title is ‘Web & Database Specialist’, though my experience in both of these puts me more at ‘novice’ than ‘specialist’.

The bulk of my work is to be on the analysis and transfer of data – including collection and transfer mechanisms, and the use of databases.
There are a couple of main projects I’ll be working on in this area:

  • Candu: A system to collaborate and present useful information held on students to their respective tutors, enabling them to easily access important details.
  • Observatory/Data Soton: These concern information that’s in the public domain, and is more about the transformation of the raw data into a meaningful resource.

Alongside these there will be multiple, smaller, side-projects of varying content and technicality.

This summer will provide me with my first real experience of working in this field – not in a mock project for my course, or as a hobby, but in an actual professional environment. This in itself is a great use of my summer, but it should also help me brush up on my technical skills – hopefully by the end of my internship I can call myself a ‘specialist’, or at least ‘competent’…

Hopefully.

Posted in Uncategorized.