Skip to content

FLAN meeting in UPF Barcelona

The theme: educator experience

The 11th FutureLearn Academic Network (FLAN) meeting was held in Universitat Pompeu Fabra (UPF), Barcelona. UPF has been a FutureLearn partner since 2015, and as for January 2017 it contributes to the platform portfolio with five MOOCs. Drs. Manel Jiménez (director of the Center for Learning Innovation & Knowledge) and Davinia Hernández-Leo (head of the Interactive Technologies group) hosted a one-day event in which the main theme was social learning and the educator experience. The hashtag was #BarcelonaFLAN.

Full house in FLAN Barcelona

The event registered high attendance, with representation from several FL partners, especially Southampton (seven of us!), the OU, and the British council.

The University of Edinburgh’s strategy

The University of Edinburgh’s (UE) VC Prof. Tim O’Shea delivered the first presentation, with a description of UE’s MOOC strategy. Tim explained how MOOCs fit within their so-called “educational portfolio with technology” vision and evolution. In the two images below, such evolution is visualised, showing how open education and use of technology will expand, with MOOCs having a central role from around 15 in 2013 to a target of 100 in 2025:

UEd strategy 2025
University of Edinburgh’s MOOC strategy 2013-2025

This evolution was explained with ecological metaphors, whereby MOOCs can survive by become relevant bigger educational products such as Honours or Masters degrees through aggregation, e.g. a Masters degree would equate to 25 MOOCs.

Nic and Lisa: embedding MOOCs in campus modules

A presentation from Southampton followed. Nic Fair and Lisa Harris shared their experience on integrating MOOCs in an on-campus module. They provided compelling suggestions on how to add value to the modules through the inclusion of the on-campus students in the MOOC learning communities, as an effective way of enhancing their personal learning networks.

Nic and Lisa
Nic and Lisa

Rebecca Ferguson: a report on FutureLearn partners research

Rebecca Fergusson (OU) presented after that. She shared a report of the research carried out by FutureLearn partners around MOOCs. The report highlights eight priority areas:

  1. Develop a strategic approach to learning at scale.
  2. Develop appropriate pedagogy for learning at scale.
  3. Identify and share effective learning designs.
  4. Support discussion more effectively.
  5. Clarify learner expectations.
  6. Develop educator teams.
  7. Widen access.
  8. Develop new approaches to assessment and accreditation

A research question was generated from each of these eight priority areas. Southampton can make a significant contribution in all these areas, but there are three that can be highlighted as being areas in which Southampton can make a significant and genuine contribution:

  • FutureLearn supports conversational learning. How can this best be implemented?
  • What are the best ways of teaching at scale and of training MOOC educators?
  • How can we increase MOOC accessibility and widen access to learning at scale?

A highlight of this report is that the University of Southampton has been identified as the most prolific FL partner institution in terms of MOOC research, of course after the Open University.

PhD researchers: the FLAN essence

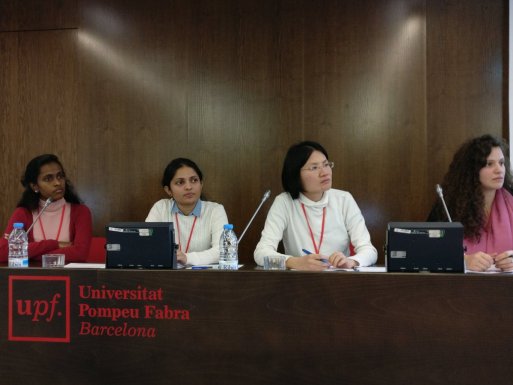
The ensemble contributions fromthe PhD students researching in FL partner universities are perhaps the most valuable asset of this academic network. In this occassion, researchers from the Open University and Universitat Pompeu fabra presented their research projects. They were all highly relevant and interesting, but I would like to highlight two of them: 1. Tina Papathoma’s work on how educators learn by being involved in MOOCs, and 2. Shi Min Chua’s contribution on the analysis of conversations in FL forums. A paper based on her research will be published in the proceedings of the FutureLearn Data workshop in the Learning Analytics and Knowledge conference in Vancouver, March 2017.
PhD researchers panel
PhD researchers panel from left to right: Kalpani Manathunga (UPF),Ishari Amarasinghe (UPF), Shi Min Chua (OU), Tina Papathoma(OU)

Other contributions and closing remarks

There were many other interesting contributions, such as the Skype session run by Mike Sharples with Ester Oliveras (UPF), Sarah Cornelius (University of Aberdeen), Sarah Speight (Nottingham), Pierre Binetruy (Paris Diderot). One of the discussions to be highlighted in that session, started by Sarah Corelius was around identified need for tools to capture and manage the most relevant comments in FutureLearn courses discussion boards so that mentors can provide optimal support to learners.

The session was not only academically very interesting, but also very fruitful: a potential collaboration with the UPF may arise from that visit, around the effects of MOOCs in universities.

We finally would like to thank Manel and Davinia for their hospitality. After the session, they offered us a tour around the facilitites of the UPF, which we gladly accepted. The only drawback was that we ended up being a bit jealous of their amazing resources for media production.


FutureLearn Academic Network Meeting

The general theme will be “International Collaboration in MOOC research“, which could include, among others: opportunities for joint research, bidding for European or other international funding, research into cross-cultural learning, and comparison of courses across countries.

The impact of eMOOCs 2016

I recently attended the eMOOCs European Stakeholders Summit in the beautiful Austrian city of Graz. The conference attracted participants from a wide range of European universities, MOOC platform providers, and other educational organisations, and participants from further afield including Chile, the USA, and Malaysia.
I presented my ideas on researching the influence of MOOCs on educators and other stakeholders in higher education in one of the first sessions of the conference. After that, I was able to enjoy interesting talks, workshops and panel sessions on a huge range of MOOC-related subjects – you can already find the conference proceedings online here. In fact, the proceedings were conveniently published before the conference itself.
A number of talks addressed issues of the impact of MOOCs on higher education – including work on MOOCs at the Technical University of Munich, and evaluation of teaching and learning in MOOCs by the experienced learning design team from the University of Delft in the Netherlands. Another interesting and valuable presentation addressed the tricky issue of ensuring quality of testing in MOOCs – this focused on ways to improve the use of multiple choice tests in MOOCs and provided some useful checklists for doing so.
The conference closed with an entertaining and interesting plea for collaboration and cooperation in MOOC accreditation from Pierre Dillenbourg of the University of Lausanne. The event provided great opportunities to develop such cooperative and collaborative initiatives – and we look forward to future improvement to all our endeavours in MOOCs.

Digital tools and ethics in MOOC research

Futurelearn Academic Network Meeting on Livestream 2015-12-10 14-40-49
Adriana Wilde – “What is success anyway?/University of Southampton ©2015

Members of the MOOC observatory recently presented at the FutureLearn Academic Network (FLAN) meeting at the University of Southampton. The meeting was well attended by a number of FutureLearn partners, coming from the universities of Bath, Bristol, Cardiff, Edinburgh, Glasgow, Groningen, Keio, Lancaster, Leicester, Reading, Sheffield, Southampton, Warwick; and the British Council, the British Library, and the Open University.

The presentations covered a range of themes around SMART tools and approaches to researching MOOCs:

 *   Ayse Saliha Sunar presented Visualisation of Social Networks by using Gnuplot in the ‘PechaKucha‘ session. She shared her experience the tool to visualise learners’ interactions and the strength of their interactions in a 3D scatter-plot graph. She particularly focused on limitations of scatter-plots in identifying learners’ interactions in massive scale.  

 *   Adriana Wilde talked about “What is success anyway? : defining success in the context of FutureLearn MOOCs”. In her PechaKucha, she showed the tensions between satisfaction and completion in terms of MOOCs course design.  The measures of success as currently understood by the community are challenged.  Completion in MOOCs (in contrast to face-to-face instruction), is no longer a reliable measure in this context as much of it depends on the goals the learner had when joining.  An alternative measure is needed.

 *   Manuel León-Urrutia presented a Learning Analytics project called The UoS MOOC Dashboard (see slides here). The project consists of a MOOC data visualisation tool for institutional stakeholders such as learning designers, educators, and it is expected to be implemented within the framework of the Southampton University Web Observatory, as the project has received funding from the Web Science Institute.

 *   Tim O’Riordan outlined his use of digital tools to reveal and analyse patterns in MOOC discussion forum comments(slides, paper). These included MS Excel (spreadsheet and VBA), NVivo (qualitative data analysis), LIWC (text analysis), Socrative (audience response), SPSS (predictive analysis), Tableau (data visualisation) and Weka (machine learning). 

 *   Steve White discussed the use of Socio-Technical Interaction Networks to understand the socio-technical construction of MOOCs in HE. This approach seeks to balance concerns with social and technical factors in understanding the use of information systems in organisations, and avoid simplistic assumptions about the impact or effects of technologies.

* In addition to the above speakers from the MOOC Observatory, Leah Marks, from the University of Glasgow presented on “Plagiarism detection in MOOC peer review”, where she shared experiences on the FutureLearn MOOC “Cancer in the 21st Century: The Genomic Revolution”.

We also enjoyed discussions of ethics in MOOC research from Professor Mike Sharples and Dr Rebecca Ferguson from the O.U. (slides), and Dr Jocelyn Wisehart from the University of Bristol.

The day was rounded off with a panel discussion on the difference between practice and research in MOOCs with Dr Su White of Southampton’s Web and Internet Science Group (Director of the MOOC Observatory) and Dr Christian Bokhove of the University of Southampton Education School.

The livestream recording of the event can be watched here.

Recently Participated in ICKM 2015

One of MOOC Observatory members , Ayse Saliha Sunar, participated in the 11th International Conference on Knowledge Management in Osaka. It was a valuable opportunity to see different perspectives of many researchers participated from different countries coming from Austria, Australia, China, Germany, Indonesia, Japan, Turkey, UK and US.

She presented her recent analysis on learners’ recurrent interactions in a FutureLearn MOOC’s online discussions. It is shown by many researchers that MOOCs have usually funnel-pattern participation, which means the number of participant in the course as well as in online discussions are decreasing. Ayse shows that this is even lower in the number of recurrent interactions. However, she said that that recurrent interactions have a pattern. A peer usually interacts several times in the same week or consequitive weeks. She concluded that this result could help us predicting learners participation and intervene their activities on MOOCs. She received numbers of beneficial feedbacks on her research from the participants.

12189437_10154457142918782_6733171279001146404_o

Her presentation is available on Slideshare.

MOBs at womENcourage 2015

ACM womENcourage is a scientific event which provides opportunites for networking with women in computer science and related disciplines.

Our 2 PhD students from MOBs and 2 undergraduates are going to join and present their posters at the event. All students have been awarded ACM-W scholarship and the University of Southampton ECS Athena Swan also supports us covering transportation and accommodation expenses.

—-

Our participation in womENcourage 15 appeared in ECS’s website. Here is the link to the news: http://www.ecs.soton.ac.uk/news/4793

12094859_922004851187787_3265444091167591433_o

Adventures in MOOC mentoring – JTEL 2015 summer school

11782472_10206913405892231_5768783567690525618_o


On Tuesday 7th July, Manuel and I gave a workshop presentation on mentor roles and coordination of mentors in MOOCs. The workshop was part of the Joint European Summer School on Technology Enhance Learning (JTEL) on the beautiful island of Ischia, Italy.

The workshop provided some background on the theories of online learning and mentoring (such as Salmon’s 5 step model of online learning) that we consider relevant for the FutureLearn MOOC platform.

Salmon’s (2000) 5 step model:

sal

We drew on ideas from our paper Mentors as connectors at eMOOCs 2015 and our experiences as University of Southampton mentors and coordinators. Participants then split into groups to plan a mentoring strategy for a MOOC of their choice.

The participants were encouraged to consider a range of decisions for planning a mentoring strategy:

  • Selection of mentor types – content experts, teachers, technical experts
  • Mentor roles – managerial, social, pedagogical, technical
  • Training – familiarising mentors with MOOC content
  • Reporting processes – managing mentors and monitoring course activity

We had good feedback on the session, and really enjoyed the workshop, the summer school, and the great Italian summer weather!

Publishable places: conferences

Below is a list of some of the more prestigious conferences at which our research may be published.

The list was derived from and Australian collection entitled computing research and education

http://portal.core.edu.au/

accordingly many of the conferences have a specific focus on computer science education or cognate academic areas, however some of them are more general  They are ranked in order  of category (A to C) and alphabetic within each category as shown below.

these are well established conferences predominantly under the ACM or IEEE banner. Because MOOCs are a relatively new phenomena,  specialist conferences in this area do not have a track record and do not appear in this rating.

Conferences such as EC Tel and the e-groups conference have established themselves as being important.

In addition there are various conferences related to the study of higher education in particular the annual SHRE conference which are of value.

Category A

ACM Special Interest Group on Computer Science Education Conference
Annual Conference on Innovation and Technology in Computer Science Education
International Conference on Artificial Intelligence in Education

Category B

Educational Data Mining
Information Systems Education Conference
International Computing Education Research Workshop
International Conference on Computers in Education
International Conference on Informatics Education and Research
World Conference on Educational Multimedia, Hypermedia and Telecommunications
Frontiers in Education
International Conference on Software Engineering: Education and Practice

Category C

ACM Information Technology Education
Asia-Pacific Forum on Engineering and Technology Education
Computing in Education Group of Victoria Conference
Conference on Software Engineering Education and Training
Functional and Declarative Programming in Education
Global Chinese Conference on Computers in Education
Informatics Education Europe
Informing Science and Information Technology Education
International Conference on Advances in Infrastructure for Electronic Business, Science, and Education on the Internet
International Conference on Cybercrime Forensics Education and Training
International Conference on Engineering Education
Software Education Conference
Software Engineering Education and Training Conference
Visualization In Science and Education
Workshop on Computer Architecture Education
International Academy for Information Management) International Conference on Informatics Education & Research
IASTED International Conference on Computers and Advanced Technology in Education
Conference on Software Engineering Education
International Conference on IT Based Higher Education and Training
IEEE International Conference on Multimedia in Education
Society for Information Technology and Teacher Education Conference
International Conference on Technology Education
World Conference on Computers in Education
Informatics in Education

Australasian

Annual Conference of the Australasian Society for Computers in Learning in Tertiary Education
Australasian Computers in Education Conference
Australasian Computing Education Conference (ACE)

MOOC Viz Interns Week 5 Update

Lubo:

This week I found a new tool for building the dashboard – Shiny.

Shiny is a web framework for R that allows users to easily create good looking analytics dashboards directly in R, without the need of any HTML or backend programming. However, a great benefit of Shiny is that it is built around HTML and if you desire, you can directly add HTML elements or apply a CSS theme. Additionally, the framework offers a good range of filtering controls and supports dynamic content. As far as visualisations go, Shiny works with some of the most popular JavaScript charting libraries, including HighCharts, D3, dygraphs and more.

Given all of its features and the fact that it can easily be understood and shared amongst the R community, we have decided to use Shiny for the final dashboard.

Most of the work I’ve done this week has been comprised of researching and learning Shiny. Apart from that, I received access to the course survey data and I was given the task of making different visualisation by filtering learners based on their survey responses. To accomplish this, I produced two scripts – one which filters out learners based on their survey responses and another that makes different analyses based on the learner ids returned from the methods of the first script.

The next step is to use the scripts I have made to build an initial dashboard using Shiny.

Lin:

This week I have completed two tasks, importing the MySQL data to a remote server and fetching course data from FutureLearn.

The first one wasn’t very difficult because I have a script which is able to import data into localhost, I just needed to change arguments so that it can import it to a remote server. However, the script didn’t work well because I had some misunderstandings about how MySQL works. MySQL works locally, so if I want to connect to a remote server, I have to create an SSH tunnel and bind it to localhost. Fortunately, there is an external module – SSHTunnel which allows us to bind remote servers easily, so far it works without error.

The second task was harder for me because of my lack of experience. The goal was to create a script that will automatically download the course data from FutureLearn and upload it to the MOOC Observatory at regular periods. To accomplish this I had to write HTTP requests in Python. Given that I have never learned anything related to HTTP before, it took me a few days to build some basic knowledge. Currently, I am just waiting for an admin account because I need to analyse admin webpage. Additionally, I need to decide a suitable period to update data depending on web server.

I think our current progress is good and I believe we are able to finish our project on time. Hopefully nothing will go wrong in the near future. I will also try my best on this project in the following weeks

MOOC Visualisation Interns Week 4 Update

Lubo:

Last week I wrote a summary blog post of the first four weeks of the internship but it never got used so I am going to use it for this week’s post.

First four weeks summary:

My development work can be divided into two categories: data analysis with Python scripts and data visualisation with Google Charts.

Data analysis scripts

At the beginning of the second week we were provided with a set of csv files containing the latest data at the time of the Developing Your Research Project MOOC. Based on the analysis tasks I was given, I started work on Python scripts that will filter the raw data and produce basic visualisations. To help me figure out the data manipulation and filtering process, I first implemented it in Libre Calc and then tried to recreate it in code. I came to realise that the analysis mostly required pivoting the data in some way so I researched the best tools for doing that in Python. In the end I decided to use the pandas library as it seemed to be the standard across the data science community and provides similar functionality to R in Python. The easiest way of installing it was through the Anaconda Python distribution which comes with a set of essential libraries for data analysis including matplotlib, which I used for simple visualisations.

The following is a list of the scripts I have developed paired with a short description of their functionality:

day_analysis.py – for each day of the course, plots the number of unique learners who have visited a step for the first time
time_analysis.py – same as for the day analysis but plots the data by hour of the day
reply_analysis.py – for each step of the course, plots the percentage of replies to comments
enrollment.py – for each day of the course, plots the total number of enrolled students

All of these scripts can be found on our GitHub repo at https://github.com/Lubo-93/MOOC-Viz-Scripts (note that they will not work without the data sets, which are not provided in the repo).

As long as the data format of the original csv files doesn’t change, these scripts will be able to filter and visualise new data as it is supplied. Since most of the csv files are similar in structure and producing the visualisations requires pivoting, not a lot of changes are needed to the code to adapt the scripts to different analysis scenarios. However, in future work the scripts could be generalised to a single script the manipulates the data depending on user supplied parameter values. This would be beneficial for the final dashboard as well. Additionally, all the scripts can export their pivots to JSON but further work is needed on correct formatting.

Data visualisation

As far as data visualisation goes, I decided to use Google Charts because of its simple API and its dashboard feature which allows you to bind multiple charts and filter controls so that they all respond together when the data or filter is modified. I learned how to develop with Google Charts during WAIS Fest for which I made a dashboard with different chart types for UK road traffic data. Although it was not completely finished, the experience taught me how to work with Google Charts and I also became aware of some of its limitations. For example, it doesn’t let you specify the regions displayed on its geo maps (e.g. the UK map only shows England, Wales, Scotland and Northern Ireland; you can’t include any more specific administrative regions). However, I discovered a workaround by using Highmaps – it allows you to specify regions with GeoJSON encoded strings or you can make completely custom maps (both of which I successfully tried, although using GeoJSON proved to be really slow). With the skills I gathered from WAIS Fest I developed a dashboard that visualises course activity and enrolment data with multiple choices of filtering.

Lin:

This week I continued with the jobs I had left unfinished from last week. I changed the table structure and used other ways to import csv files into MySQL. Currently, it seems work well and take less time. After a discussion with Lubo and Manuel, I decided to use this version for the time being.

Besides importing efficiency, fetching data quickly is another factor I need consider. MySQL allows us to set up an index to accelerate searching, but it take more time to insert data because MySQL should assign an index to each row. So there is a balance we need decide.

After dealing with MySQL, we started to learn a new programming language for data analysis – R. R is easy to learn and use. To compare it with Python, it costs less time to work out same data. I studied all the chapters in the R online tutorial and now I am familiar with the syntax and have learned about some quite useful and interesting features of R. I also tried to convert my python scripts into R and compared both – I think R works better. During the following week, I will keep going on with my research on R.