
Google Analytics and University of Southampton Blackboard service
Google Analytics (GA) is turned on within a number of MLE sites including Blackboard and Panopto. In the interest of openness we will share a number of pieces of analytical data with the community. Note that some data is from a smaller sample size and may not reflect 100% of users.
For Blackboard these stats are:
- Unique Visitors / Page Views
- Users per hour of day heat map
- Engagement
- Browsers
- Computer, Mobile, or Tablet?
- Operating System
- Location (Country)
- Top 10 Screen Resolutions
- Average Page Load Time
This data does not include those users who block Google Analytics. If you wish to stop your web usage from being tracked by Google Analytics and other web bugs and trackers install Privacy Badger. If you are interested in making your browser as secure and untrackable as possible take a look at this guide.
This report is based on 100% of sessions.
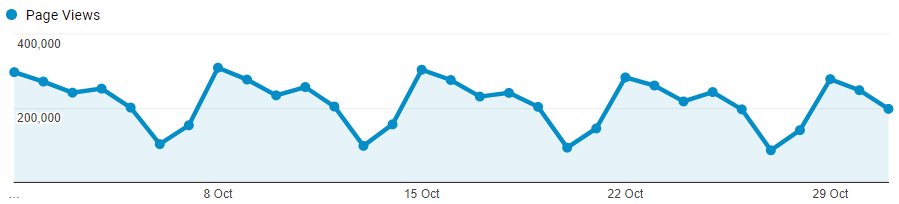
Unique Visitors / Page Views
| Unique Visitors | AY 2016/17 | Pageviews | Unique Visitors | AY 2017/18 | Pageviews | AY 2018/19 | Pageviews | Unique Visitors |
| Aug-16 | 1,118,715 | 39,938 | Aug-17 | 1,334,441 | 42,795 | Aug-18 | 1,533,301 | 46,195 |
| Sep-16 | 1,360,189 | 54,542 | Sep-17 | 1,452,975 | 53,834 | Sep-18 | 1,644,592 | 54,103 |
| Oct-16 | 6,521,998 | 154,651 | Oct-17 | 7,175,132 | 152,500 | Oct-18 | 6,709,932 | 137,447 |
| Nov-16 | 6,272,166 | 159,587 | Nov-17 | 6,570,628 | 147,321 | Nov-18 | ||
| Dec-16 | 3,894,788 | 112,740 | Dec-17 | 3,894,281 | 96,321 | Dec-18 | ||
| Jan-17 | 5,871,879 | 115,784 | Jan-18 | 6,154,315 | 103,474 | Jan-19 | ||
| Feb-17 | 4,924,927 | 132,587 | Feb-18 | 5,166,916 | 115,722 | Feb-19 | ||
| Mar-17 | 4,510,635 | 120,837 | Mar-18 | 3,717,158 | 95,054 | Mar-19 | ||
| Apr-17 | 2,905,829 | 84,454 | Apr-18 | 3,923,311 | 97,548 | Apr-19 | ||
| May-17 | 6,097,974 | 124,097 | May-18 | 5,999,899 | 113,918 | May-19 | ||
| Jun-17 | 1,330,411 | 54,780 | Jun-18 | 1,415,966 | 51,283 | Jun-19 | ||
| Jul-17 | 1,129,327 | 40,381 | Jul-18 | 1,322,435 | 43,868 | Jul-19 |
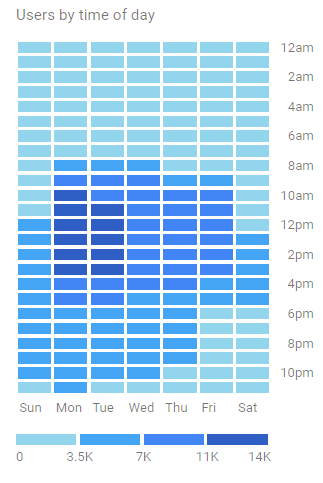
Users per hour of day heat map
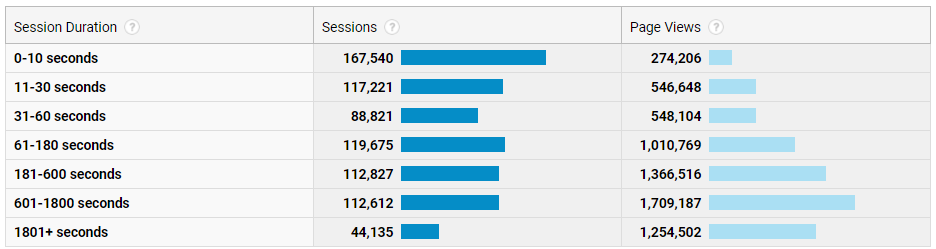
Engagement (how much time visitors spend using Blackboard)
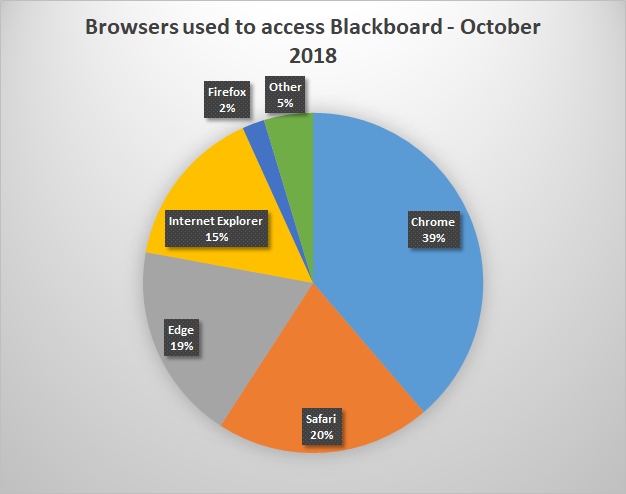
Browsers
| Browser | Number of Users |
| Chrome | 53,113 |
| Safari | 28,024 |
| Edge | 25,706 |
| Internet Explorer | 21,017 |
| Safari (in-app) | 3,999 |
| Firefox | 2,904 |
| Android Webview | 1,264 |
| Samsung Internet | 494 |
| Opera | 265 |
| Android Browser | 194 |
| Amazon Silk | 79 |
| UC Browser | 40 |
| Puffin | 17 |
| Mozilla Compatible Agent | 13 |
| ‘Mozilla | 10 |
| Maxthon | 6 |
| Opera Mini | 5 |
| (not set) | 4 |
| YaBrowser | 4 |
| SeaMonkey | 3 |
| BlackBerry | 2 |
| Coc Coc | 1 |
| IE with Chrome Frame | 1 |
| Sogou web spider | 1 |
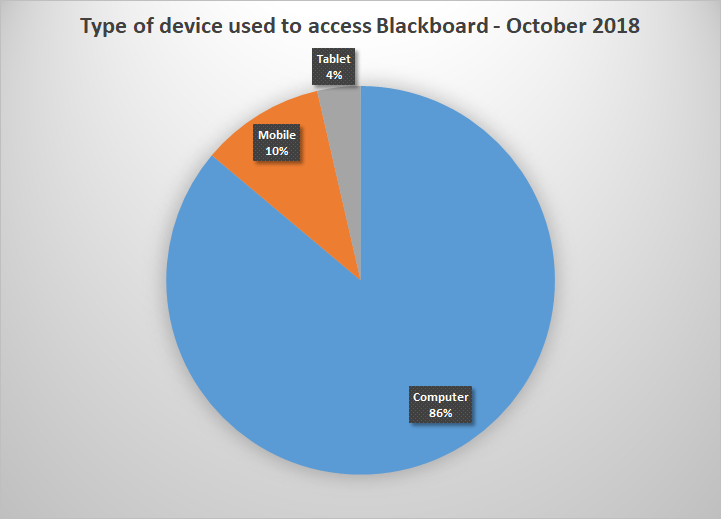
Computer, Mobile, or Tablet?
| Type of Device | Number of Sessions |
| Computer | 656,947 |
| Mobile | 78,502 |
| Tablet | 27,382 |
Operating System
| Operating System | Number of Users |
| Windows | 90,559 |
| iOS | 22,516 |
| Macintosh | 16,307 |
| Android | 6,695 |
| Linux | 697 |
| Chrome OS | 407 |
| (not set) | 32 |
| Windows Phone | 10 |
| BlackBerry | 4 |
| UNIX | 3 |
| Xbox | 2 |
| FreeBSD | 1 |
Country/ Territory
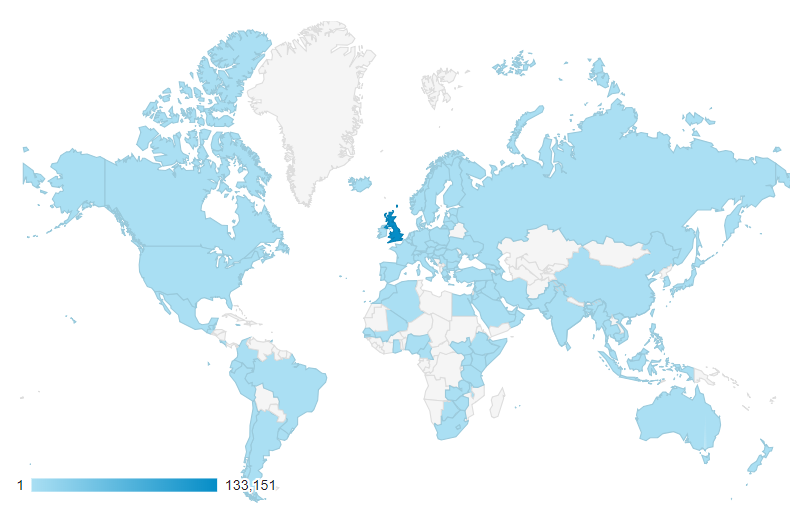
| Country/Territory | Unique Visitors |
| United Kingdom | 133,151 |
| Malaysia | 1,211 |
| China | 1,090 |
| United States | 507 |
| Germany | 301 |
| Spain | 212 |
| France | 204 |
| Singapore | 122 |
| Mexico | 120 |
| India | 104 |
| Thailand | 104 |
| Ireland | 95 |
| United Arab Emirates | 89 |
| Italy | 81 |
| Hong Kong | 74 |
| Netherlands | 69 |
| (not set) | 68 |
| Australia | 60 |
| Greece | 60 |
| Saudi Arabia | 60 |
| Canada | 59 |
| Bahrain | 58 |
| Japan | 49 |
| Norway | 48 |
| Turkey | 45 |
| Romania | 41 |
| Nigeria | 38 |
| Portugal | 36 |
| Belgium | 34 |
| Sweden | 34 |
| Taiwan | 32 |
| Jersey | 31 |
| Poland | 29 |
| Switzerland | 28 |
| Ukraine | 27 |
| South Korea | 26 |
| Austria | 25 |
| Bulgaria | 25 |
| Botswana | 24 |
| Denmark | 23 |
| Brazil | 22 |
| Russia | 21 |
| Cyprus | 20 |
| Czechia | 19 |
| Ghana | 19 |
| Kenya | 19 |
| Indonesia | 16 |
| New Zealand | 16 |
| Qatar | 16 |
| Vietnam | 16 |
| South Africa | 16 |
| Hungary | 15 |
| Jordan | 15 |
| Colombia | 14 |
| Estonia | 14 |
| Latvia | 11 |
| Barbados | 10 |
| Lebanon | 10 |
| Finland | 9 |
| Pakistan | 9 |
| Croatia | 7 |
| Sri Lanka | 7 |
| Luxembourg | 7 |
| Oman | 7 |
| Philippines | 7 |
| Guernsey | 6 |
| Slovenia | 6 |
| Slovakia | 6 |
| Tanzania | 6 |
| Zambia | 6 |
| Brunei | 5 |
| Kuwait | 5 |
| Lithuania | 5 |
| Malta | 5 |
| Argentina | 4 |
| Chile | 4 |
| Egypt | 4 |
| Isle of Man | 4 |
| South Sudan | 4 |
| Antigua & Barbuda | 3 |
| Ecuador | 3 |
| Ethiopia | 3 |
| Iraq | 3 |
| Iceland | 3 |
| Maldives | 3 |
| Malawi | 3 |
| Peru | 3 |
| Azerbaijan | 2 |
| Cameroon | 2 |
| Jamaica | 2 |
| Morocco | 2 |
| Macedonia (FYROM) | 2 |
| Mauritius | 2 |
| Trinidad & Tobago | 2 |
| Uganda | 2 |
| Uruguay | 2 |
| Zimbabwe | 2 |
| Anguilla | 1 |
| Bangladesh | 1 |
| Bermuda | 1 |
| Belize | 1 |
| Costa Rica | 1 |
| Algeria | 1 |
| Georgia | 1 |
| Gibraltar | 1 |
| Guatemala | 1 |
| Israel | 1 |
| Iran | 1 |
| Cambodia | 1 |
| Cayman Islands | 1 |
| St. Lucia | 1 |
| Lesotho | 1 |
| Mali | 1 |
| Myanmar (Burma) | 1 |
| Macau | 1 |
| Palestine | 1 |
| Réunion | 1 |
| Serbia | 1 |
| Seychelles | 1 |
| Senegal | 1 |
| Somalia | 1 |
| Syria | 1 |
| St. Vincent & Grenadines | 1 |
Top 10 Screen Resolutions of devices used to access Blackboard
| Top 10 Screen Resolutions | Number of Sessions |
| 1366×768 | 142,936 |
| 1440×900 | 132,591 |
| 1920×1080 | 92,941 |
| 1536×864 | 66,513 |
| 1280×800 | 64,604 |
| 1280×720 | 52,050 |
| 1680×1050 | 29,519 |
| 375×667 | 28,734 |
| 768×1024 | 15,905 |
| 1280×1024 | 15,118 |
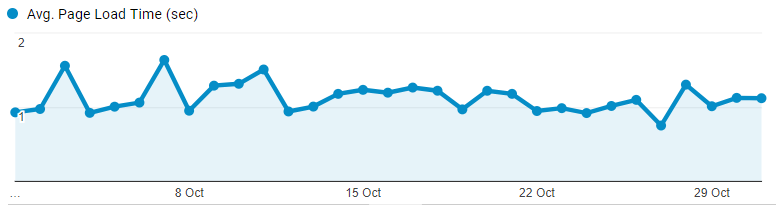
Average Page Load Time
Those on the Southampton University network experienced a 1.11 second average page load time.
Those accessing from within the UK experienced a 1.66 second average page load time.
The worldwide average page load time was 1.78 seconds.
| Country | Avg. Page Load Time (sec) |
| Israel | 0.89 |
| Switzerland | 1.12 |
| Serbia | 1.37 |
| Ukraine | 1.61 |
| United Kingdom | 1.66 |
| Belgium | 1.69 |
| Sweden | 1.76 |
| Latvia | 1.78 |
| Ireland | 2.13 |
| Austria | 2.15 |
| Luxembourg | 2.18 |
| Romania | 2.24 |
| Netherlands | 2.58 |
| Finland | 2.62 |
| Greece | 2.68 |
| Denmark | 2.69 |
| (not set) | 2.7 |
| Poland | 2.71 |
| Italy | 2.79 |
| Philippines | 2.95 |
| Norway | 2.96 |
| Germany | 3.2 |
| Czechia | 3.23 |
| Lebanon | 3.44 |
| Portugal | 3.63 |
| Cyprus | 3.93 |
| South Korea | 4.09 |
| Botswana | 4.09 |
| Canada | 4.26 |
| Spain | 4.43 |
| United Arab Emirates | 4.56 |
| France | 4.57 |
| Malaysia | 4.68 |
| Tanzania | 4.7 |
| Croatia | 4.76 |
| Jordan | 4.81 |
| Azerbaijan | 4.89 |
| Zambia | 5.3 |
| Turkey | 5.4 |
| Mexico | 5.46 |
| Bulgaria | 5.64 |
| Thailand | 5.69 |
| United States | 5.95 |
| Hong Kong | 6.21 |
| Russia | 6.46 |
| Bahrain | 6.72 |
| Australia | 6.77 |
| Japan | 7.2 |
| Algeria | 7.5 |
| India | 7.89 |
| Singapore | 8.64 |
| Nigeria | 8.85 |
| Taiwan | 8.93 |
| Vietnam | 10.27 |
| Kuwait | 11.11 |
| Qatar | 12.39 |
| China | 12.95 |
| Saudi Arabia | 13.24 |
| Ethiopia | 13.91 |
| Colombia | 18.29 |
| Indonesia | 18.93 |
| Iceland | 29.5 |
| Slovakia | 30.22 |
| New Zealand | 32.01 |