
We’ve been using Google Analytics (GA) to monitor our VLE service since July 2013. Whilst GA is used to monitor many University services the Blackboard team are the only one to share that information in the spirit of openness and fairness in a post-Snowden world.
We publish monthly reports that cover interesting elements of the data and make it freely available to all. This month we have dropped some sections and introduced some new ones.
What was dropped?
Language of the Operating System: this information can be suggested from the country and city of users.
Keywords typed into Search Engines to reach Blackboard: whilst it was fun seeing how many people spelt Blackboard wrong, or searched for Blackboard at another University and ended up at our service, it was not considered to be very valuable or interesting.
Network / ISP of user: Whilst this was interesting to see different ISPs, including Universities from around the world, it was felt that other areas were more interesting to look at.
What has been added?
Page view heatmap by date
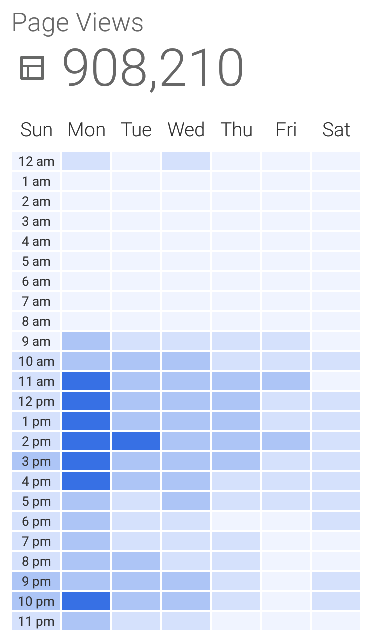
This heatmap shows on which days in the reporting month activity was highest. This shows us that Monday was the most popular day to access Blackboard in August. How will that change over time? Add this blog to your feedly/RSS feed and find out!
See the heatmap in the latest analytics report for August 2015
Computer / Mobile / Tablet
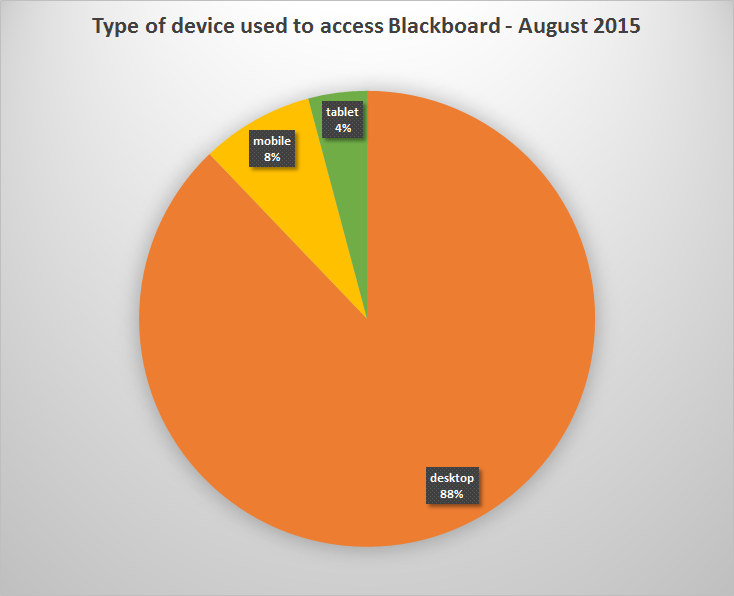
Which type of devices were used to access Blackboard? The desktop/laptop is still king.
See the device breakdown for August 2015.
Resolution
We list the recurrence of monitor resolutions per Blackboard session. Right now the 1366×768 resolution is most popular. This resolution is found on cheap laptops. Cheap laptops and not ipads are still the most popular device for students
See the screen resolutions details for August 2015
Average Page Load Time in Seconds
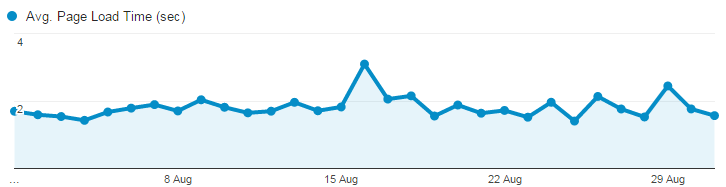
The longer a web page takes to load the more frustrated the end user feels. Our new data centre helped Blackboard to perform much faster.
We also provide a table showing the average page load time in each country from which our Blackboard service was accessed. Students and staff in some countries will receive a poor page load time and are recommended to use the Southampton Virtual Environment which should help to speed things up.
https://www.southampton.ac.uk/isolutions/services/southampton_virtual_environment/
See the average page load time details for August 2015
What’s still not included
We would like to report on the average time spent using Blackboard. However there is a well known issue that Google Analytics cannot know how long you spent on the last page of a site you visitied. See http://www.analyticsedge.com/2015/03/misunderstood-metrics-time-on-page-session-duration/ for an explanation.
Therefore we are not reporting on this information since it will not be accurate.
Accuracy and opt-outs
That’s not to say the the other data is necessarily totally accurate and should be used as a guide. It’s easier to spoof data to Google Analytics using tools such as Secret Agent or to just block Google Analytics entirely using tools such as Privacy Badger or Ublock Origin.
Everyone who uses the web should understand how they are tracked online, this guide provides suggestions on how to take back control of what information you allow your web browser to leak to strangers: https://help.riseup.net/en/better-web-browsing