
We recently migrated the University of Southampton Blackboard Virtual Learning Environment from the basement of the Maths Tower to the new iSolutions data centre which is located about 20 miles off campus.
This wasn’t a simple case of unplugging it, putting it in a white van, and driving it over, but a complex migration over the extended network into a brand new hardware setup running on a different operating system, using brand new storage and load balancers. You can find out more of the technical details in the tech team blog.
The average user doesn’t care about such topics however, so what benefit does the new infrastructure bring to the average student or member of staff of the University of Southampton?
Speed Improvements
The most significant tangible benefit is that the new infrastructure is much faster.
Looking at two measures and comparing yesterday Monday 16 December’s data with that of the previous Monday 9 December’s data here one can see the improvements.
First let’s look at Server Response Time. This is the measure of how quickly Blackboard responds to your requests. In the graph below, provided by Google Analytics, the orange line represents the old infrastructure in the Maths tower basement and the blue line represents the new infrastructure in the new data centre. The lower the response time the faster Blackboard is responding, so the lower the blue line the better your experience.
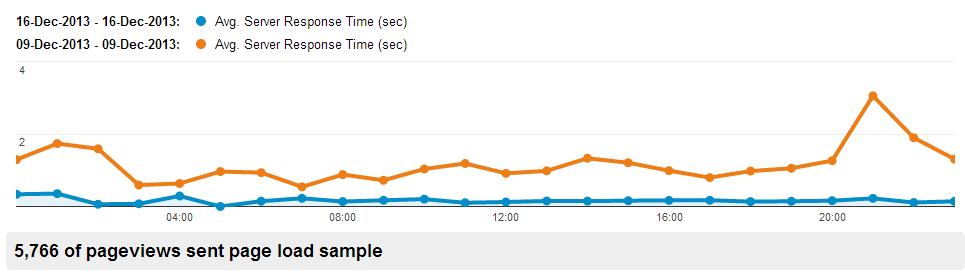
Server Response Times – Lower is better
The overall improvement is that the average response time is now 0.16 seconds seconds compared with 1.23 seconds. That’s 6.6 times faster, a breath-taking improvement!
Next let’s look at Average Page Load Time. This means the time it takes from you clicking on a link in Blackboard, e.g. to access a course, and the resulting content loading on your computer screen or mobile device.
The difference to the previous measure of server response time is that there are many more external factors influencing the result, in particular the speed of your own Internet connection and the speed of your own computer or mobile device. The better your connection and the faster your computer the better the result you will experience.
Since these figures are based on an average this will encompass both the student abroad with a cheap laptop and the academic in Southampton with a water-cooled custom built over-clocked workstation using a fibre optic connection to the internet. Again the orange line is the old infrastructure and the blue line is the new infrastructure.
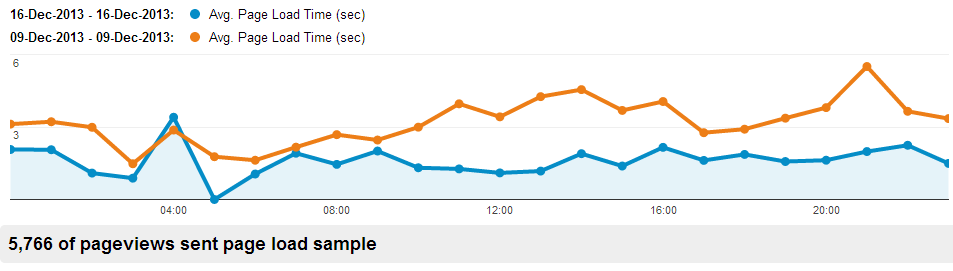
Page Load Times – Lower is better
The differences are less pronounced since we have only changed the Blackboard infrastructure, not upgraded the computers and Internet connection of all our users but still the average for the day is 1.59 seconds to load a page on the new infrastructure compared with 3.65 seconds in the old infrastructure. That’s 2.3 times faster, another fantastic achievement!
Future benefits
Our new infrastructure should be much easier to extend, so if we need to give the servers more oomph in terms of CPU power this can be given simply by reconfiguring the virtual machines running Blackboard rather than migrating to new server boxes. More memory and disk space can be given in the same way too. This should mean that less downtime is required when we need to increase capacity.
The faster infrastructure also means that we can apply patches and software upgrades more quickly. This will hopefully mean that when we upgrade next summer we will only need to take the system down for a weekend, rather than a week.
Conclusion
The new infrastructure puts our Virtual Learning Environment service into a very good position for 2014. Enjoy your Christmas vacation and look forward to more improvements throughout 2014!
Thanks
Thanks to the Blackboard Migration Team who gave up their weekend to do this work:
David Bell
Sam Cole
Matt Deeprose
Mike Frost
Tim Sewell
Clayton Peters
December 17, 2013 @ 1:39 pm
Nice one Matt and team – keep up the good work! Ian
December 17, 2013 @ 2:34 pm
Yes, I believe this new infrastructure will be highly valued by the student and academic community and delivered so swiftly. Well Done! Bob
December 18, 2013 @ 8:10 am
Interesting read. Thanks.
January 10, 2014 @ 3:29 pm
Nice.
http://i.imgur.com/xuY1Beq.gif