
The new semester is now in full swing and as we start to get into Week 2 it’s worth reviewing how Blackboard has responded to the increased usage that a new semester brings particularly when one considers this year’s intake of new students is the highest ever.
This graph shows how between 22 September and 5 October Blackboard usage in terms of number of pages of Blackboard accessed per day rose significantly, whilst at the same time the average time that it took for a user to receive a fully loaded page showed no deterioration.
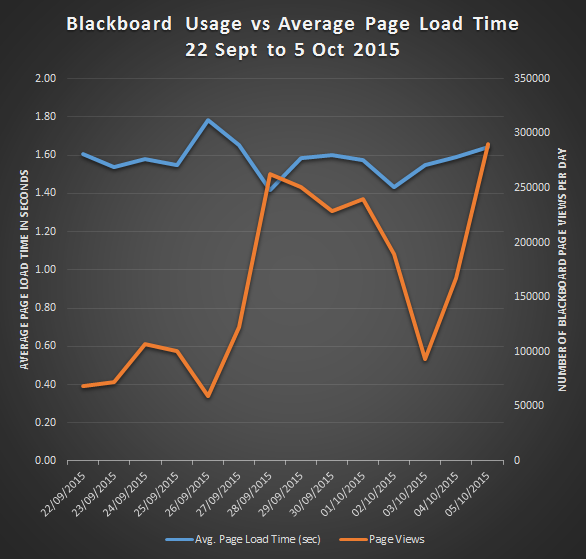
The average page load time is often considered to be the best measurement of page responsiveness. You can find out more here: https://blog.kissmetrics.com/loading-time/
That there was no deterioration in page load time reflects the investments iSolutions has put into the Blackboard infrastructure and our continued determination to improve service quality.