He ran his fingers across the dust console leaving a trail of clear glass showing the controls beneath. He paused. It had been quite some time since he had last flow this ship, so he took a moment to try and remember the controls. Gingerly he tapped some of the buttons. An explosion echoed through the ship and an alert displayed on the console, “Uncaught TypeError: Cannot read property ‘id’ of undefined”. “Hmm, how about this?” he mused tapping the console again, this time the bridge came to life.
This week has seen me dusting off my JavaScript skills in the aid of making a route finding map prototype for campus. So in its simplest terms this is a graph traversal problem. But before I jumped into coding a graph traversal algorithm I needed to find some way to represent the map. The form I decided on was reasonably simple, I only modelled the nodes and these nodes had the properties of a unique numerical ID, a label for describing the location, a geometric point, and a list of nodes to which it was connected. I decided upon this because it allowed for one-way edges which could represent exit only doors.
Next came the implementation of the graph traversal. The method I used was a modified Breadth-First search which instead of enqueuing newly explored nodes to end a queue, I instead inserted them into an array which was ordered by cost (distance) travelled, and the least travelled node was expanded next.
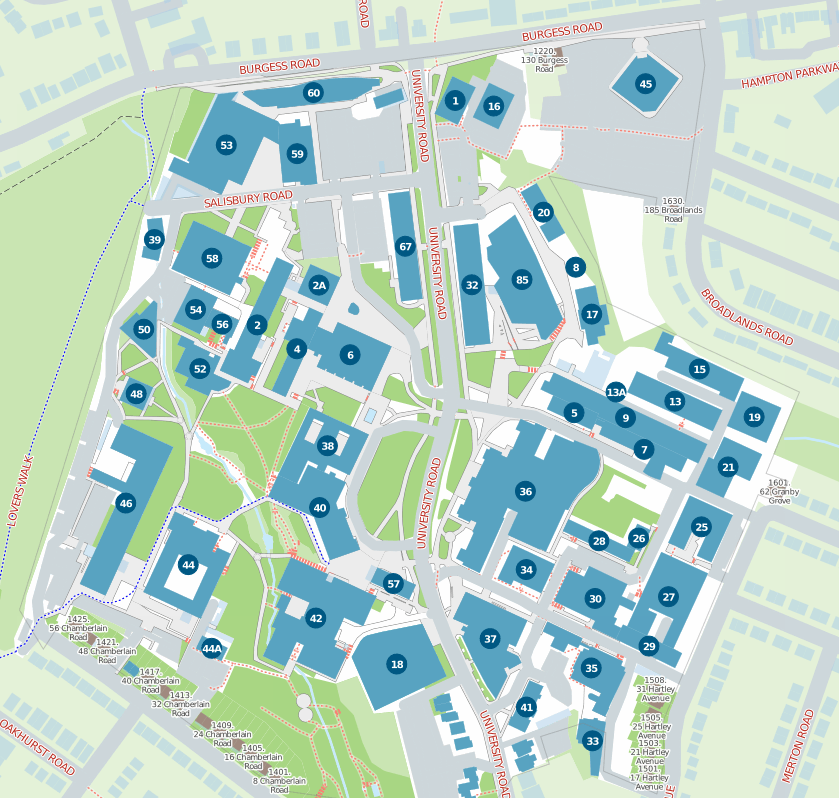
The underlying data I was using was a list of university building entrances, but this list was incomplete and also didn’t help with navigation as just drawing a line from one door to another will not help anyone navigate anywhere unless they can fly. So I manually created intermediate nodes on paths and crossings, typically where the path forked or crossed a road. As I was only making this data for a prototype I did it sporadically and just arbitrarily picking a spot on the route I was trying to add and working from there, but on I decided this was not a good way to move forward once the main program was working so I spent time using GIMP2 to simplify a university map down to the elements I needed to see to decide where to place nodes.
I started with this Map:
Then spent time reducing the colour of the image, primarily using tools such as Posterize, which reduces the number of colours in an image, and the ‘Select by Colour Tool’, which I would use to select an all a specific colour on the map and recolour it all. After several hours of this and some manual cleaning up of the image I produced this three colour Map:
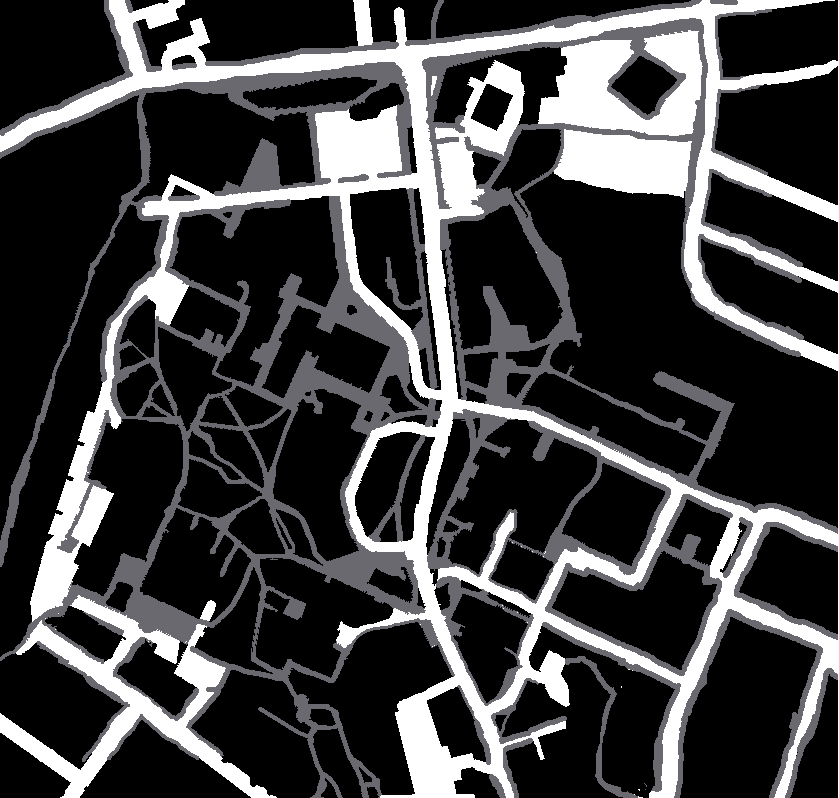
Here we see roads in white, paths/paved areas as grey and impassible areas (grass and buildings) in black.
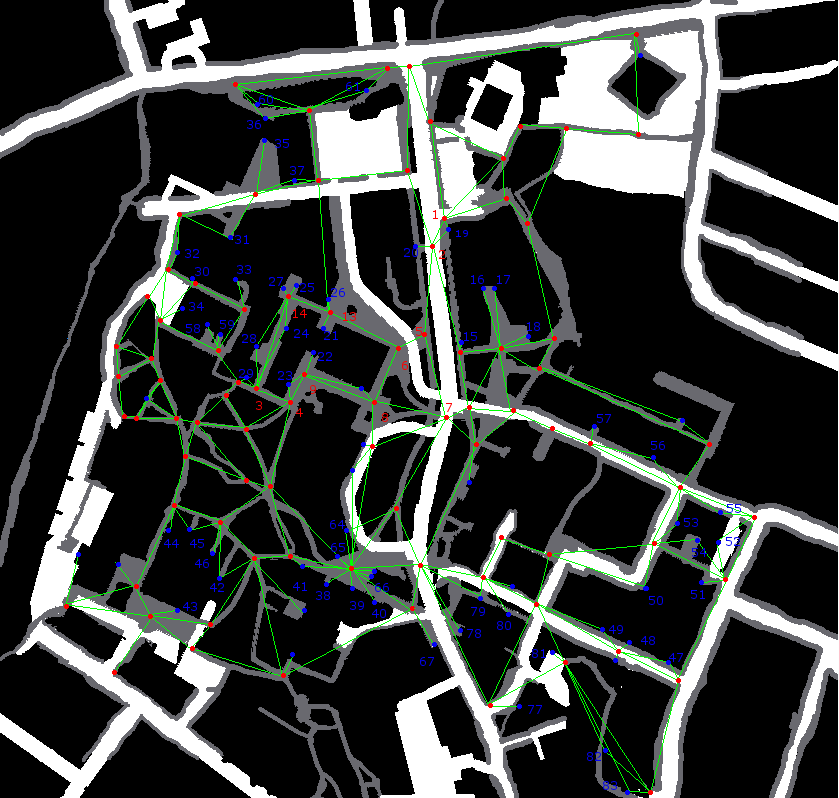
Now it was a matter of adding nodes to the map, I started by adding blue dots to represent doors and then added red dots for forks in paths and road crossing. Finally I connected these nodes with green lines to represent traversable paths. This gave me this map:
Now that I had the graph I could remove the underlying map and see the graph I had created:
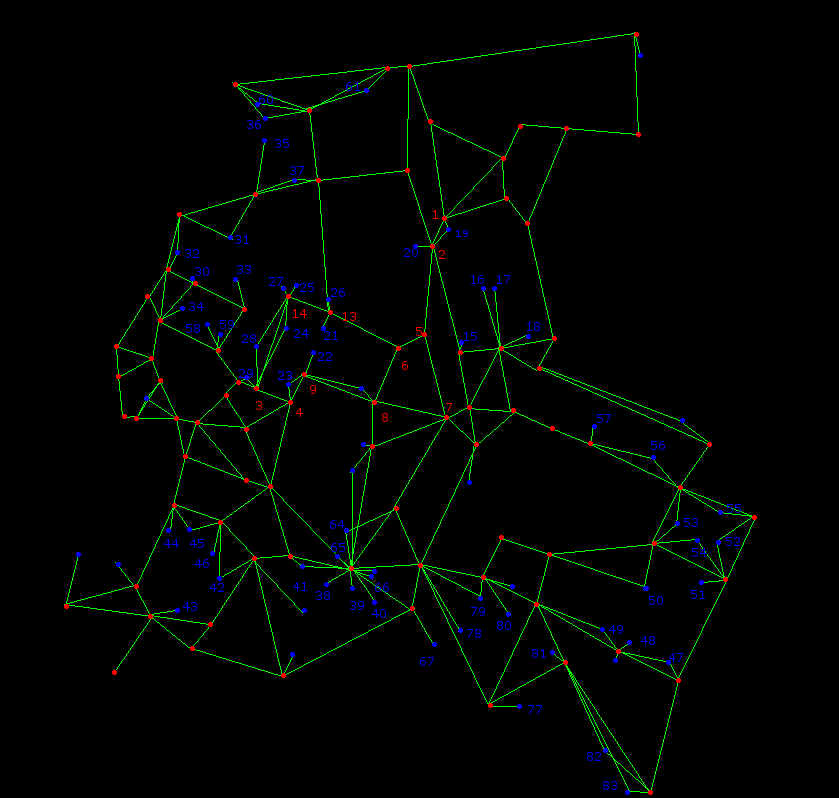
Which I personally think looks quite nice, but more importantly will allow me to expand upon the data in my prototype in a logical and well thought out way.


0 Responses
Stay in touch with the conversation, subscribe to the RSS feed for comments on this post.