An international workshop on turbulence and the resulting sedimentary responses was held in The Abdus Salam International Centre for Theoretical Physics, Trieste, Italy. The meeting spanned three days over 23 – 25 February, 2015 and covered topics that ranged from the coastline to the deep sea. There was a good balance between theoretical modelling of turbulence (using LES), laboratory experimentation and field measurements. Keynote lectures were given by Anna Wahlin on turbulence in dense plumes in polar settings, Rui Ferreira on turbulence in fluvial environments, Marga Garcia on deep sea currents revealed from geophysical records, Marta Ribo on internal wave interaction with the sea floor, Olivier Simonin on 3-D turbulence modelling at small scales, and Federico Falcini on processes controlling sediment transport in the marine environment.

A keynote was also presented by Carl Amos of the Geology and Geophysics Research Group (Coastal theme). This keynote focussed on four uncertainities in the field of turbulence and sedimentary processes: (1) the influence of turbidity on turbulence/drag reduction; (2) the relationship between complex bed roughness and hydrodynamic roughness (drag); (3) the relative roles of skin friction and form drag on sediment transport; and (4) the distribution of shear (Reynolds) stresses through the benthic boundary layer. The literature is confusing, divided and inconsistent in the evidence and application of these four uncertainties despite 50 years of active research into the subject. It is clear that there is a need to return to detailed (controlled) experimentation using modern instrumentation that provide measures of turbulence at small scales and high frequencies.
The conclusions of the Workshop was that there is a clear need for a team effort to improve our understanding and modelling capacity in the realm of turbulence and sediment transport. Further meetings will be planned between participants in order to examine possibilities of EU funding in the future.
A brief abstract of Prof Amos’s talk is given below:
The role of turbidity on shear stress in the benthic boundary layer, and other issues
Carl L. Amos, National Oceanography Centre, Southampton
University of Southampton
There are a number of fundamental issues related to the derivation of bed shear stress estimates in the pursuit of predictions of sediment transport. While measures of thresholds and transport rates have been measured extensively under laboratory and natural conditions, the parameterisation of associated bed shear stresses has been ambiguous. This is because of four important, yet often poorly treated, assumptions. Briefly, these are:
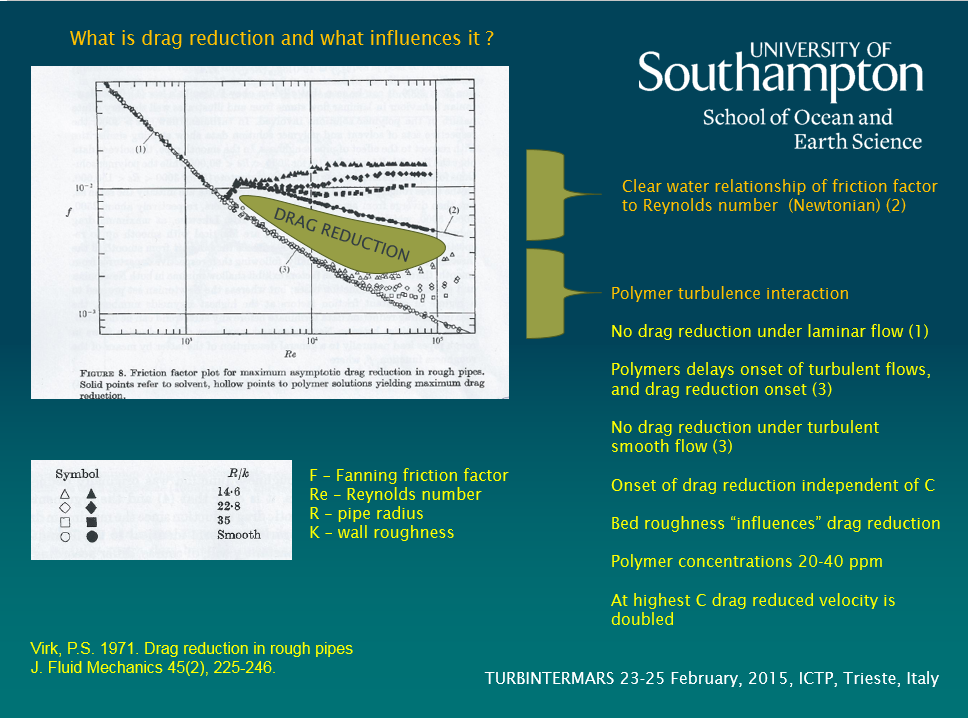
- The role of suspended sediment concentration (C) in drag reduction, and viscosity;
- The relationship between bed roughness and hydrodynamic roughness;
- The relative roles of skin friction and form drag on sediment transport; and
- The vertical structure of shear (Reynolds) stresses through the benthic boundary layer.
It is my contention that by using standard (and well publicised) methods for estimating bed shear stress, bed roughness, kinematic viscosity, eddy viscosity etc. errors can accumulate and therefore, results from different studies may not be comparable. Most models/estimates of bed shear stress are based upon clear water equivalents. My work (Amos et al., 1992) suggests that even low values of C influence the transmission of momentum in a fluid and hence reduce bed shear stress. There has been a significant amount of work on this topic at wide ranges in C (Amoudry and Souza, 2011; Best and Leeder, 1993; Brostow, 2008; Cloutier et al., 2006; Thompson et al., 2006; Winterwerp and van Kesteren, 2004) and there is no doubt that drag reduction takes place; the question is at what level of C does this occur and how is it defined. All estimates of shear stress measured in Sea Carousel (as an example) account for drag reduction, most models do not. The amount of drag reduction is also disputed: Wang et al., (1998) suggest a reduction of 10% between 20 and 230 g/L, whereas Best and Leeder (1993) suggest a reduction of 30-50% up to 2 g/L. The work undertaken by Thompson et al. (2006) suggest a 40% reduction to 120 g/L but no reduction below values of 2 g/L. Winterwerp and van Kesteren (2004) suggest that fluids are non-Newtonian even for C < 0.5 g/L and von Karman’s constant is less than the normally accepted value of 0.41. Clearly the literature is varied and confused on this subject, but has an important role on suspended sediment stratification. Soulsby et al. (1983) has suggested that there is a density gradient created by the suspension of sediment that inhibits mixing in the vertical (z). They use the Monon-Obukhov parameter (L) to define mixing to buoyancy suggesting that where z/L < 0.03 flows are neutral, but where z/L > 0.03 flows are stratified and thus no longer subject to the Rouse theory of sediment distribution in the water column. There is growing evidence to suggest that there is a nearbed region (mm to cm thick) of high C below the Roussian layer, where C is maintained through turbulence dampening. This may be problematic as estimates have shown that most of the sediment transport (advection) takes place in this nearbed region.
The use of roughness length (Zo), bed roughness (ks) or drag coefficients make broad assumptions about homogeneity of the bed and about the representativeness of a single scalar for a complex population of roughness scales of natural beds. Results from work carried out in Sardinia examines this in the context of a muddy, heterogeneous bed occupied by patches of sea grass. Results show that there is convergence between hydrodynamically-derived roughness length (zo) and bed roughness (ks) from which a suitable drag coefficient may be derived.
Finally, the constant stress region of the inner boundary layer is a convenient assumption that leads to Law of the Wall and fits to the classical Clauser plot (1956). However, much of the fundamental data comes from grain-roughened pipes or beds and thus exclude form drag. The application of a constant stress is implicit in theories such as that of Rouse (for the suspension of sand in the benthic boundary layer). Divergences in the literature will be examined and discussed within this context.
References
Amoudry, L.O. and Souza, A.J. 2011. Impact of sediment-induced stratification and turbulence closure on sediment transport and morphology modelling. Continental Shelf Research 31, 912-928.
Amos, C.L., Grant, J., Daborn, G.R. and Black, K. 1992. Sea Carousel – a benthic, annular flume. Estuarine, Coastal and Shelf Science 34, 557-577.
Best, J.L. and Leeder, M.R. 1993. Drag reduction in turbulent muddy seawater flows and some sedimentary consequences. Sedimentology 40, 1129-1137.
Brostow, W. 2008. Drag reduction in flow: Review of applications, mechanism and prediction. Journal of industrial and Engineering Chemistry 14, 409-416.
Clauser, F.H. (1956) The Turbulent Boundary Layer. Advances in Applied Mechanics 4, 1-51.
Cloutier, D., LeCouturier, M.N., Amos, C.L. and Hill, P.RR. 2006. The effects of suspended sediment concentration on turbulence in an annular flume. Aquatic Ecology 40, 555-565
Thompson, C.E.L., Amos, C.L. Angelaki, M., Jones, T.E.R. and Binks, C.E. 2006. An evaluation of bed shear stress under turbid flows. Journal Geophysical Research 111, C04008, 8p.
Wang, Z.Y., Larsen, P., Nestmann, F., and Dittrich, A. 1998. Resistance and drag reduction of flows of clay suspensions. ASCE, Journal of Hydraulic Engineering 124(1), 41-49.
Winterwerp, J.C. and van Kesteren, W.G.M. (2004) An Introduction to the Physics of Cohesive Sediment Dynamics in the Marine Environment. Publ. Elsevier, 466p.