Project management tools are vital for a successful project (Bakouros, Dr. Yannis, 2000). Likelihood of proportion of occurrence of mistakes would be reduced by implementation of these tools (Bakouros, Dr. Yannis, 2000). The project environment has a high chance that unexpected conditions might occur. For example, unpredictable results might be found. These might be a reason for failing the project, or it might reduce the quality of the project. Therefore, utilizing the techniques and tools of project management could be a key to overcoming these issues. Advantageously, the former offers a project team the chance to identify uncontrollable tasks as well as controllable ones (Bakouros, Dr. Yannis, 2000). Consequently, The One Percent team decided to choose a Gantt Chart as a suitable project management tool, as it provides features (discussed later) in addition to ease of usability.
The Gantt chart is a “project planning tool” offering chance of tracking tasks and activities of the project(Durfee, 2008). The reason behind chosen this tool is the simplicity of construct the tasks and tracking tasks and sub-tasks (Durfee, 2008). Gantt chart can be used to order and schedule tasks and activities of a project, each of which is pictured in horizontal bar over time (Durfee, 2008). each task takes a place in a row where Date takes a place in a column (Durfee, 2008). Start date as well as end date are recorded in order to compare whether goal is achieved or in a risk. To implement Gantt Chart, the online Smartsheet application is used. This smartsheet offers features as follows:
- Simplicity of use in terms of tackling icons, drop and drag, and also import and expert features. In addition, it can be incorporated with google sheet.
- It allows you to have a cooperation with other participants. It provides, for example, alert feature which it can send over an email to them for reminding.
- Completion feature, which is calculate the proportion of accomplishments out of 100 and also number of days that have been spent, is useful.
- It can be also set a rule in order to specify each member’s tasks with using a certain color.
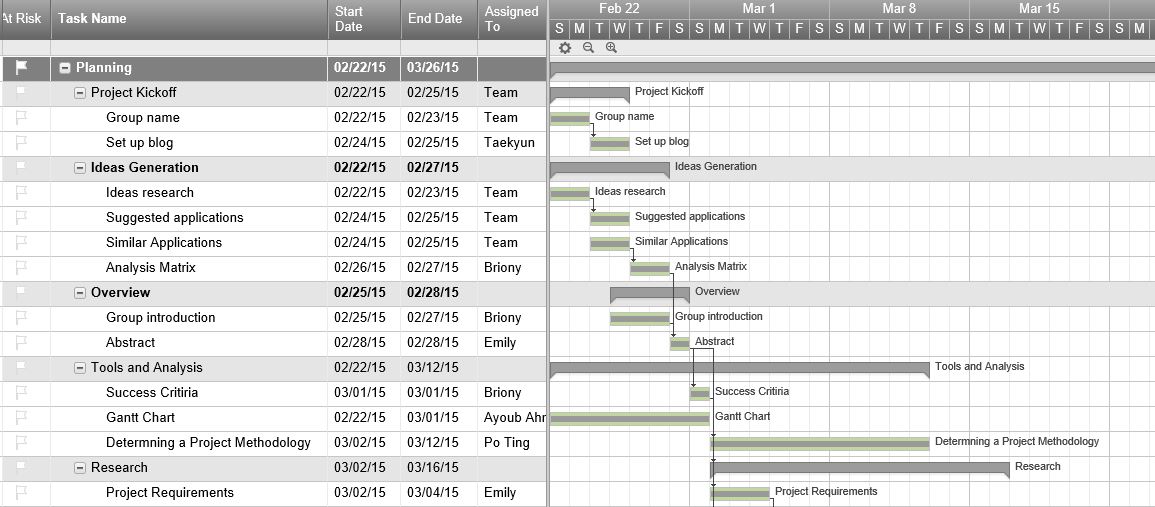
There are three main phases in TravelSafe project plan, each of has sub tasks assigned to a team member. The phases are:
- Planning phase consists of six task each of which has sub-tasks.
- Design phase consists of six task as well.
- The final phase is future works which are survey, focus group and testing the application.
The following pictures illustrate a part of planning stage of our project using Gantt chart. To read full plan online visit the following link: (Full project plan) and to download PDF version click on Full Project Plan PDF.
In conclusion, this blog aims to show the importance of project management tools to improve project time management. Therefore, this project lists the Smart sheet named Gantt chart which is being used in The One Percent project.
This post represents that coherent structure and story are present in the portfolio which uses the entry and tags mechanism of the blog system. It tells the story of the project by explaining individual roles clearly, explaining why these were decided, and what outcome they will produce later on in the project.
In addition this post represents Media Use by incorporating a gantt chart as a method for time and resource management.
This post also represents that the group has chosen appropriate project steps that directly link to the marking criteria. The project steps were chosen intelligently to produce a project of professional quality, leading to a successful product.
References
Bakouros, Dr. Yannis, D. V. K. (2000). Project Management, 0–32.
W. Durfee, Oct 2008, Project Planning and Gantt Chart