Archive for category Conclusions
TravelSafe Key Features Demo
Posted by Ashiru Ali in Conclusions, Design, Innovation and Creativity (Idea), Media Use on 29/04/2015
As the conclusion to the project the group would like to demonstrate how the app TravelSafe may be used. Download version can be found in TravelSafe Key Features Demo
The demo draws upon multiple design and engineering stages that have been developed throughout the project, for example logo and wireframe designs, emphasis is placed on the key features of the product; obvious screens such as “Login” (or authentication via the API of popular social networks), “Logout”, Language Translation” have been left out of this demo.
This post represents a visual conclusion to the project and summarises the product in a clear and concise way. As a result it also summarises the design steps that occurred throughout the project, illustrating the developmental story. The presentation and designs are both innovative and creative.
Project Conclusion
Posted by Briony Gray in Conclusions, Innovation and Creativity (Idea), Media Use, Structure and Story on 29/04/2015
Summary of the project
The aim of the project was to conceive, research and design the TravelSafe application to the point where it can then be subjected to extensive product testing, qualitative and quantitative research. As part of this development the group has kept an online journal that records our work out-put, project decisions and research outcomes in a clear and professional manner. These are easy to access and to follow, and are tagged in a coherent way that corresponds to the marking criteria. Each member has contributed to the online portfolio, and consequently to the development of the product.
Throughout the portfolio the group has explained and recorded many posts which illustrate a number of criteria. These include: an analysis matrix to compare multiple different suggestions, success criteria, similar applications research, establishing a target audience as well as justifying the reasons behind platform choice and pricing, determined a project methodology, sought and adapted the project to expert advice, numerous designs steps including theory and logo designs, numerous engineering steps and diagrams such as UML and class diagrams, utilised background research to influence engineering steps, and developed a product that may fit into a potential market.
What the group has produced

Design number 1.
The One Percent are pleased to announce the introduction of the TravelSafe application and its video demonstration.
TravelSafe is a mobile application for anyone travelling anywhere in the world, whether at home or abroad. The application will consist of a safest route generator, which generates three safe routes from point to point, as well as a safety rating of areas within a given city which are both generated using open data and crime statistics. It will also provide travel information, such as bus and train times, locations and maps as well as weather information including severe weather updates and safety tips compiled from embassies, the World Health Organisation and social media and news feeds. Other functions will be the ability for the user to input information such as their travel insurance, flight details and important numbers, such as a lost credit card and incorporation of translation functionality. Finally, there will be a resource pack available to download which will provide a summary of the information and can be accessed offline to avoid roaming costs.
Next Steps
Our next steps are to collate our work so far in order to pitch the idea of TravelSafe to a Dragon’s Den panel. We will be pitching for funding to help us continue with the user-based research for our application, as well as the costs of implementation and testing. This is of paramount importance to the product as in order for the app to advice on safety all data sets, usability and reliability must be at the highest level otherwise individuals may potentially be put in danger. Any remaining funding will then be used in the process of releasing our application, such as advertising initiatives including a company website.
Broken down, these are the proposed uses for the funding:
- market research: from user focus groups to expert opinions, funding will be used to attract participants and host these events in order to obtain a better understanding of the types of users and their ideas for the application
- implementation: if needed, money will be used to cover any costs for licensing, hardware or software
- testing: as with the market research, funding will be used to gather groups of users in two stages to test prototypes of the applications
- release: funding will also be used to release the application to the market, covering costs such as advertising and the creation and hosting of a business website
extra: any leftover funding will be used to cover overheads such as staff costs as well as further development costs as needed. This may vary depending on test results and dataset reliability.
Written by Briony and Emily.
This post represents Structure and Story, Creativity and Innovation categories within the marking criteria. This is evident as the post sums up the overall project, presents the product the group has created, outlines future steps for its development beyond our project and demonstrates innovation and creativity in both product idea and future considerations.
Success Criteria Revisited
Posted by Briony Gray in Conclusions, Media Use, Structure and Story on 28/04/2015
At the beginning of the project a list of Success Criteria were identified, which were based upon the marking criteria for the assignment. At the end of the project the set of criteria would be evaluated against the work out-put recorded in the portfolio. To recap, our list of the 15 Success Criteria is shown below:
- To have submitted a project brief (approx 200 words) that summarise our project and how we will go about organising its different stages.
- To have kept a running blog (portfolio) of our activities as a group throughout the assignment process, on which each member will post work and research associated with the project.
- To have evidence of participating in meetings with their appointed project mentors, and with other members of the group throughout the assignment process. These can be found throughout the blog entitled ‘Meeting Summary’.
- To have submitted a reflective summary by each member of the project team at the end of the project.
- To present a summary of our project followed by a Q&A session at the end of the assignment.
- To have a project that uses design appropriate social network solutions and interface or extend the designs of existing social network infrastructures.
- To have written evidence of being able to identify and analyse social network characteristics in the portfolio.
- To have written evidence of being able to identify and interpret domain and societal requirements for the deployment of social network solutions in the portfolio.
- To have evidence of group work and group organisation throughout the entirety of the project.
- To have evidence of clear stages of planning and research throughout the project, with equal contributions from all members in a number of topic areas that may include design, research, graphics, and technical issues.
- To produce a finalised description of our project at the end of its course, which includes explanations of its different features, the methodology used to select these features, and a realistic prediction of how this product may be used by the target audience.
- To have clear evidence of market and user research which have been used to underpin the design and technological choices of the project.
- To have clear evidence of tailoring our project based on research undertaken, literature reviews and expert opinions.
- To have submitted a portfolio that demonstrates a social networking solution to a gap in the market which has been undertaken in a professional and well organised manner, and in an original way.
- To have a product that has been developed to the point of needing further testing and qualitative research (which requires funding more than our means, and more time). This means that the product, at its completion, will have extensive background research, design stages, and engineering designs and may only be improved through further testing to the wider public which we ourselves are unable to do. This is a realistic goal for our project as it demonstrates an ability to produce and work on a product to a high standard, but also realistic time management as this product has a limited time and is run alongside other courses and coursework.
The evaluation matrix of this can be seen here, please click to enlarge.
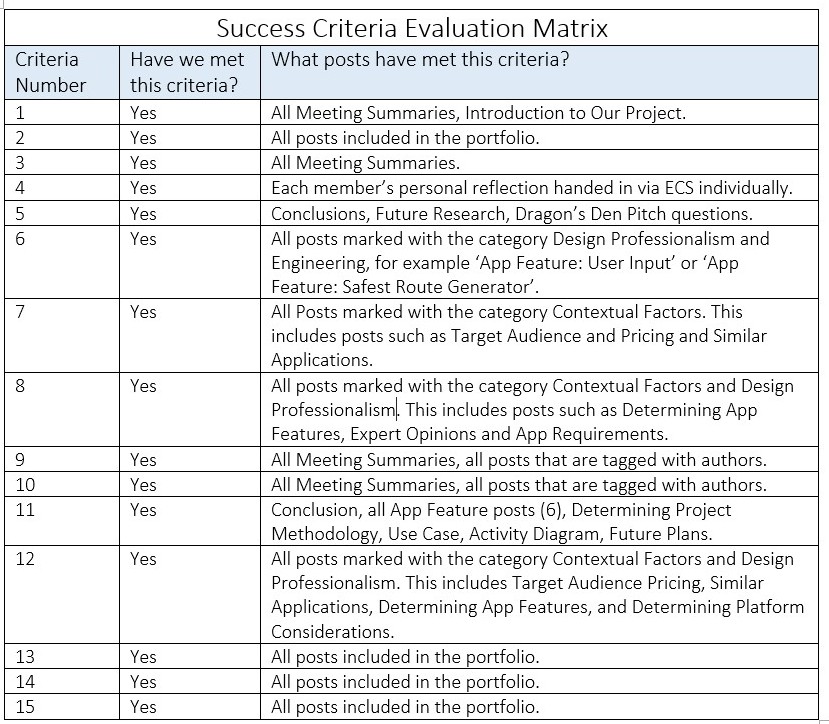
An evaluation matrix of the original Success Criteria.
Written by Taekyun, Millie and Briony.
Cost Analysis for Future Testing
Posted by Po Ting Tse in Conclusions, Engineering, Innovation and Creativity (Idea), Media Use, Structure and Story on 27/04/2015
Introduction
Based on the future test plan and refined project plan, this post presents a vague cost analysis for the testing and release of the product.
Requirements Testing
The requirements testing contains 17 tests, which relate to 11 functional requirements and 6 non-functional requirements. The application will be tested with free automated validation tools.
As scheduled, the whole testing will be assigned 15 days, with 2 application testers working full time. According to ITJobSearch.co.uk which monitors the UK IT job market, an average annual salary of software testing job is £38,000. Therefore, the salary for hiring two application testers during the testing periods would be estimated to be £3200.
On the other hand, the facility and equipment cost may contribute to around £500, which includes buying two mobile devices for testing.
Accessibility Test
This test will be assigned 8 days to complete. Since the group will use free web accessibility evaluation tools (Pearce, 2015), no software fee contributes in this test category.
User Testing
This test will be assigned 8 days to complete. Firstly, it was a tough decision to decide how many users would be involved in the user testing, since the number of users will affect the estimated testing costs and time required. Researchers have various opinions on the number of users involved in the user testing, some suggested 5 users would be enough (Virzi, 1992), some claiming that 5 was not enough (Spool & Schroeder, 2001), while some suggested it should be around 8 to 12 (Hwang & Salvendy, 2010), and some claimed that 15 could cover most of the usability problems (Jakob & Landauer, 1993).
The group decided to keep the voluntary users number above all of the minimum ones that researchers suggested. Finally, the group agreed that the minimum number of user will be 2 sets of 15 voluntary users, resulting 30 users in total. By assuming each user contributes to £10 of the place rental cost, the place rental for user testing would be £300. On the other hand, the facility and equipment cost may contribute to around £500, which could be buying one additional mobile device for testing.
Release cost
The release cost is basically the publishing fees on different mobile application platforms. Up to 25th April, the Android Play’s (http://developer.android.com/distribute/googleplay/start.html) registration fee is USD$25 (ie. £16) and the iOS Developer Program’s (https://developer.apple.com/programs/ios/ ) is USD$99 each year (ie. £65/year) .
Estimated total cost for the testing and release of the product
Therefore, table 1 is the estimated cost for the testing and release of the product, which the total cost would be £4381 . From the pie chart in figure 1, the requirement testings dominate the cost, while user testing and release cost result are less than a quarter of the cost.
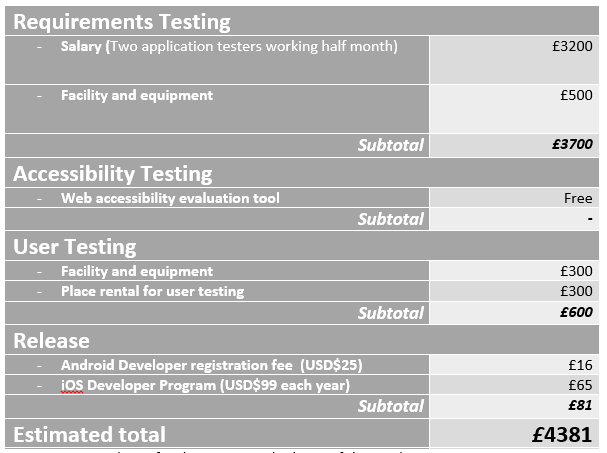
Table 1: Estimated cost for the testing and release of the product
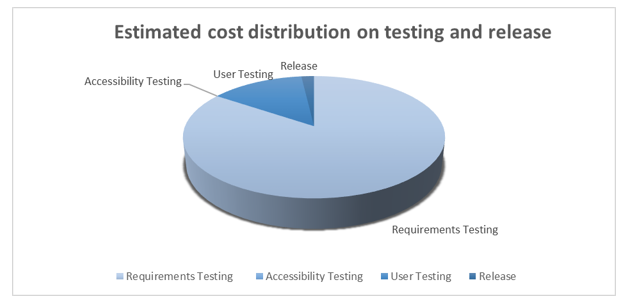
Figure 1 Estimated cost distribution on testing and release product
Conclusion
This post gives a vague cost analysis for the testing and release of the product, and the estimated total cost would be £4381. The costs mentioned above are minimal expenses. Other factors, such as using proprietary software, recruiting users for testing and marketing, are not be considered in this analysis.
This post represents considerable consideration of the product above and beyond the marking criteria and the success criteria, showing innovation. It illustrates a realistic plan for a cost benefit analysis of the product which would be a vital component to testing and further development, showing story and structure. It also features media components to illustrate this such as a pie chart. Finally, this post discusses the break down of engineering stages and the costs that these would have.
References
Hwang, W. & Salvendy, G., 2010. Number of people required for usability evaluation: the 10±2 rule. Commun. ACM, 53(5), pp. 130-133.
Jakob, N. & Landauer, T. K., 1993. A mathematical model of the finding of usability problems. ACM Proceedings of the INTERACT’93 and CHI’93 conference on Human factors in computing systems., pp. 206-213.
Pearce, E., 2015. Future Test Plan for the App. [Online]
Available at: http://blog.soton.ac.uk/onep/2015/04/27/test-plan/
[Accessed 25 April 2015].
Spool, J. & Schroeder, W., 2001. Testing Web Sites: Five Users is Nowhere Near Enough. In: CHI ’01 Extended Abstracts on Human Factors in Computing Systems. Seattle: ACM, pp. 285–286.
Virzi, R. A., 1992. Refining the test phase of usability evaluation: How many subjects is enough?. Human Factors: The Journal of the Human Factors and Ergonomics Society , 34(4), pp. 457-468.
By Po Ting Tse