Several University of Southampton case study buildings of different age and state of repair have been monitored over longer time periods looking at environmental parameters such as temperature, relative humidity and carbon dioxide concentration. Measurements were made at five minute intervals over several weeks for each building. The scope of these studies was to identify the environmental performance levels of selected buildings and to relate these findings to the occupant surveys conducted inside the same buildings.

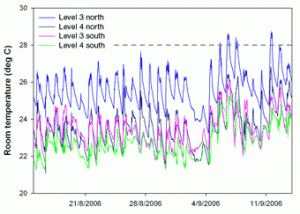
Fig. 1 – Temperature monitoring of four offices in the old part of the University’s PV atrium building, measured over a four weeks period in August / September 2006.
Figure 1 shows an example for the office room temperatures of 4 offices inside the old part of the University’s George Thomas Building (administration) which is linked to a new building part via a PV atrium. The data which was gathered over four weeks in August / September 2006 was obtained from two south and two north facing offices on different levels of the building. Interestingly the two north facing offices were observed to be hotter than those on the south elevation. In the previous summer of 2005, the north facing offices were observed being cooler as it would generally be expected. Two reasons were identified for this observation; the fact that the mechanical ventilation control systems for the atrium were used correctly in summer 2006 after some difficulties in 2005 and that the users of the south facing offices showed informed ventilation behaviour.
Besides highlighting issues with the summer performance of selected office buildings, studies looking at the winter case were undertaken in buildings with poor thermal insulation and air-tightness. For example, temperature monitoring conducted in February 2007 on a single level inside a tower block on the University’s Highfield Campus revealed stark differences in room temperatures between the south-west side and the north-east side of the building.

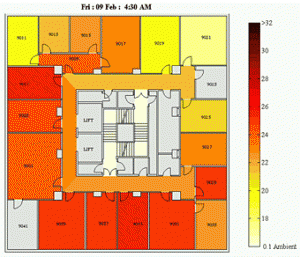
Fig. 2 – Office room temperatures inside a tower block, 9th of February 2007 at 4.30 h in the morning (grey areas: no monitoring data available).
This is shown in Figure 2 which depicts the office temperatures at 04.30 in the morning. The observed difference was found to be attributable to the underfloor heating system which had its main hot water inlets on the south-west side of the building resulting in a considerably warmer base temperature inside the offices of this orientation. The heating system performed poorly with some offices of the single glazed building having temperatures of around 26 °C at 04.30 in the morning whilst other offices hardly ever exceeded 19 °C without additional electrical heaters.
In extended heatwave periods tower blocks without mechanical cooling devices like the one described above run the risk of severely overheating due to their exposure to the elements.
This is shown by the animation below of monitoring data for a hot day in July 2006: Office temperature animation