Little is known about the possible effects that a large number of tidal turbines would have on the local tidal regime. Having some idea is important, not only for the purpose of predicting power output (it could be reduced due to reduced flow speeds), but also for environmental impact assessment. Field data on these effects are lacking, as arrays of turbines are yet to be constructed; the effects are also difficult to reproduce in physical models due to scale effects.
It was decided to go down the route of CFD simulation for this work as it was necessary to simulate tidal streams around the headland in the first instance due to the sparsity of available tidal stream data. However, individual turbines are too small to be simulated directly in a coastal numerical model on the scale of tens of kilometers, as to resolve both the smallest and largest scales in the flow would entail excessive computational expense. There are a number of solutions to the problem of representing this sub-grid scale process, including:
- Using a coarse scale model to provide input boundary conditions as time series to a highly localized model of the generator array. At some level, this approach will be necessary to restrict the size of the domain to manageable proportions; however, the boundary will generally be chosen to ensure that the flow perturbations within the domain are small at the boundary.
- Coupling a coarse scale model to a fine scale model of the array where the generators are better represented, and run the two models concurrently. This would require a significant amount of programming and computational effort.
- Applying forces distributed to nodes within the modelling domain to represent the generators as ‘sinks’ of momentum. The effect of this is to add roughness to portions of the mesh; this method can not reproduce the wake structure behind the turbines, but may be able to adequately reproduce the large scale flow patterns. This solution was chosen and implemented in the TELEMAC model.
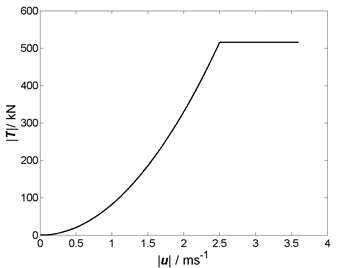
Variation of thrust with flow speed for simulated generator unit
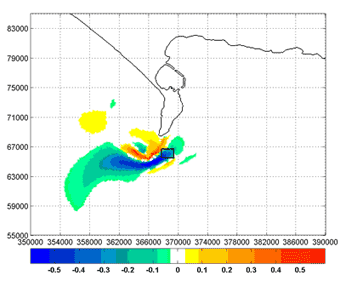
Difference in flow speed (m/s) when energy extraction is applied in the area indicated by the rectangle. Yellow to red indicates an increase in flow speed at the time-step, green to blue a decrease. White indicates that the magnitude of the change is less than 3 cm/s.
To investigate the effects on tidal flows at Portland Bill, due to a hypothetical array (or ‘farm’) of tidal stream generators, a numerical model of the tidal flows around the Portland Bill headland was developed using the TELEMAC system.
View tidal animation in Google Earth
The effects of turbines were included in the model as an additional roughness retarding the flow.
The additional roughness was calculated on the basis of 160 generator units consisting of:
- Horizontal axis turbine:
- Diameter 16 m
- Rated speed 2.5 m/s
- Thrust coefficient 0.8
- Thrust (opposing flow) limited to rated thrust (515 kN) for speeds greater than 2.5 m/s (see first figure.
Typical of the results are presented in second figure as an animated plot of difference in flow speed when energy extraction is applied, compared to that in the natural state. It can be seen that there are reductions in flow speed ahead of and in the wake of the generator array – as expected – but also increased flow speeds on either side of the array, particularly between the array and the headland. It is possible that flow speed changes might have an effect on the mobile sands on either side of the headland.
This work formed a major part of Luke Blunden’s PhD.