Erevnametrics: Research Object Builder UI 2
Now the RO builder has actually taken shape, this is a blog post to show what it looks like, and the current capabilities/limitations of the UI at present. First, a screenshot showing what the tool looks like before adding any content :
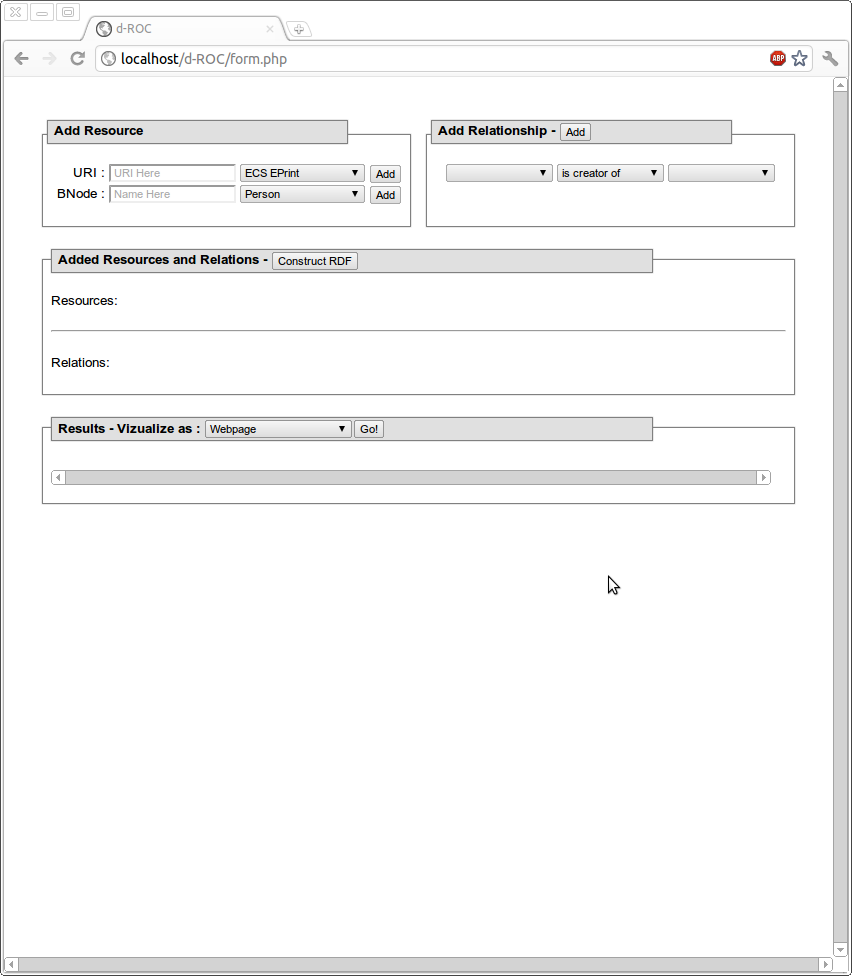
As you can see, there are 2 fields to add either objects that have URIs, or user created ones – blank nodes. There is also a field which allows you to relate objects to each other, after they’ve been added. Through this tool, you add a URI, which is handled by a shim, generating RDF on the object, passed back to the tool, which then generates the representation of the object. Here is the tool after adding two papers, and what’s contained in the folding :
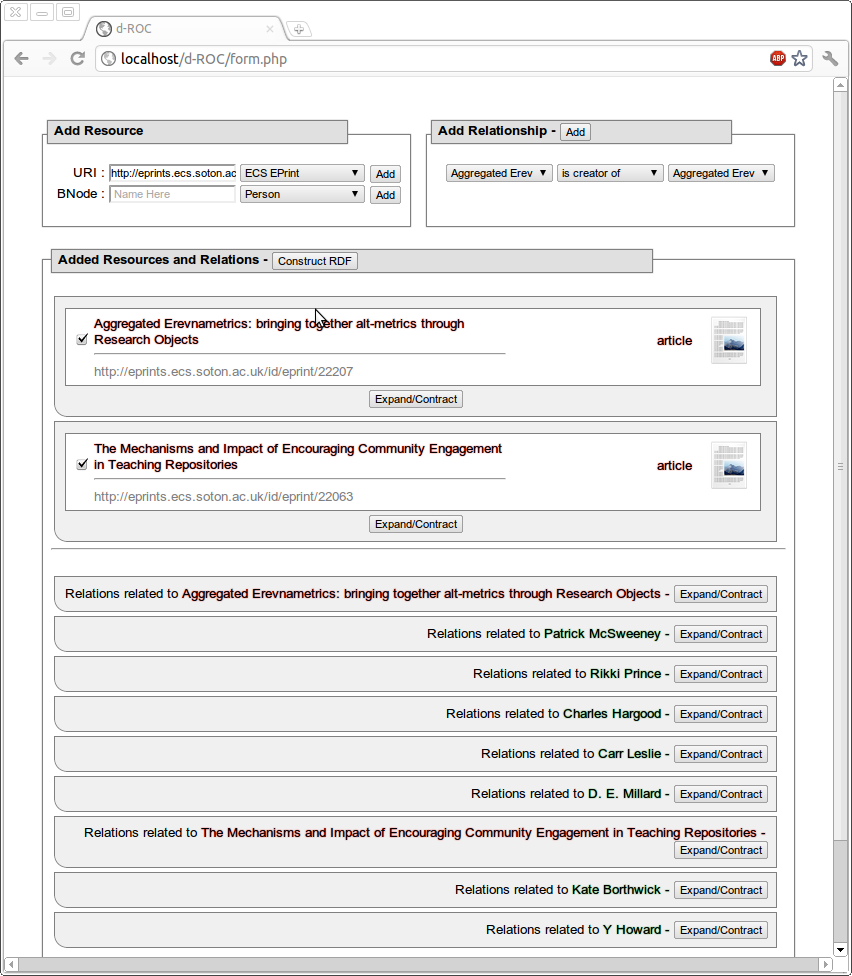
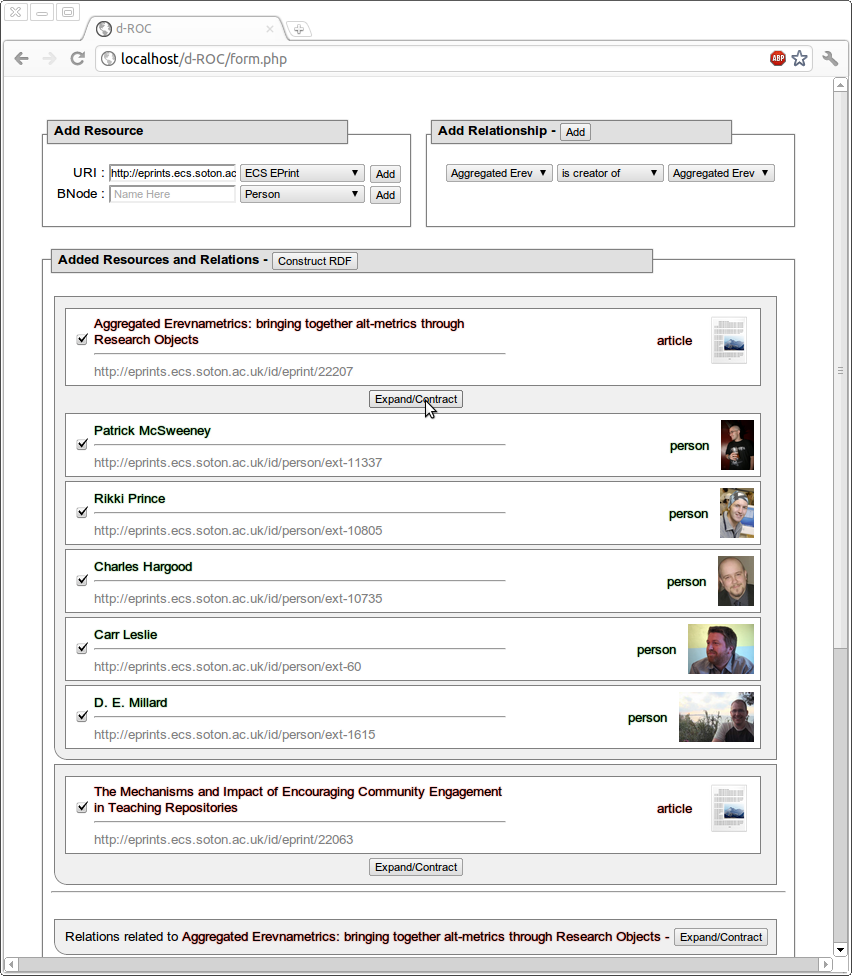
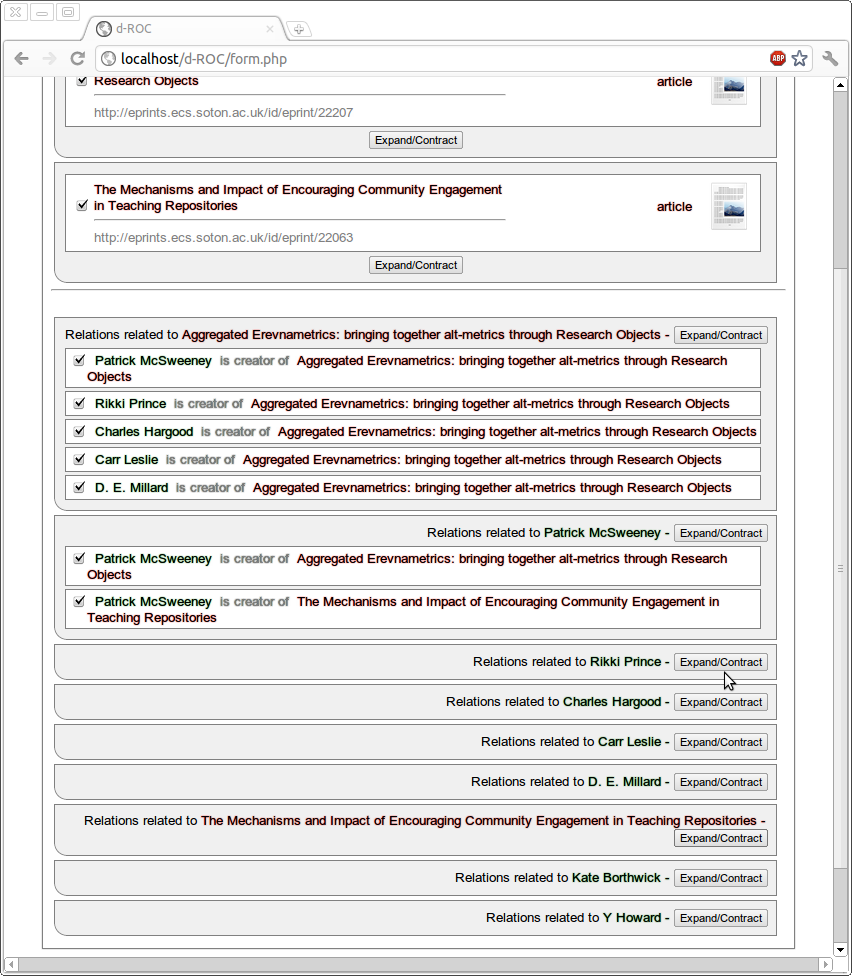
As you can see, adding an EPrint also adds all the authors as people, and relations showing that they are the authors of a particular paper, and then their resource entries are grouped under that fold. The resource folding is such that if the same author is associated with a different resource fold, or is added as a stand alone resource, de/selecting any of their entries will deselect the lot. Relations are all folded, and added to a fold named after each resource – as an example, if person A authored paper B, then the relationship A authored B will appear under both the fold for all of A’s relations, and all of B’s. As with resources, selecting / deselecting the relation works globally. Adding relationships between two resources will add the second resource into a group for the first resource – or turn a singular resource into a group. With owl:sameAs links, the first resource is treated as the main resource, and the two resources are merged, and all instances of the second resource replaced with the first. As an example: if you have person A, bnode B, and paper C, and also the relations A and B are creators of C, if then the relation A is sameAs B is added, the tool will represent this to the user by merging B with A, so all that is visible to the user at the end will be resources A and C, and the relationship A is creator of C.
After a user has added whatever resources they need, and any appropriate relations, they will create RDF based on this – by clicking the “Create RDF” button.
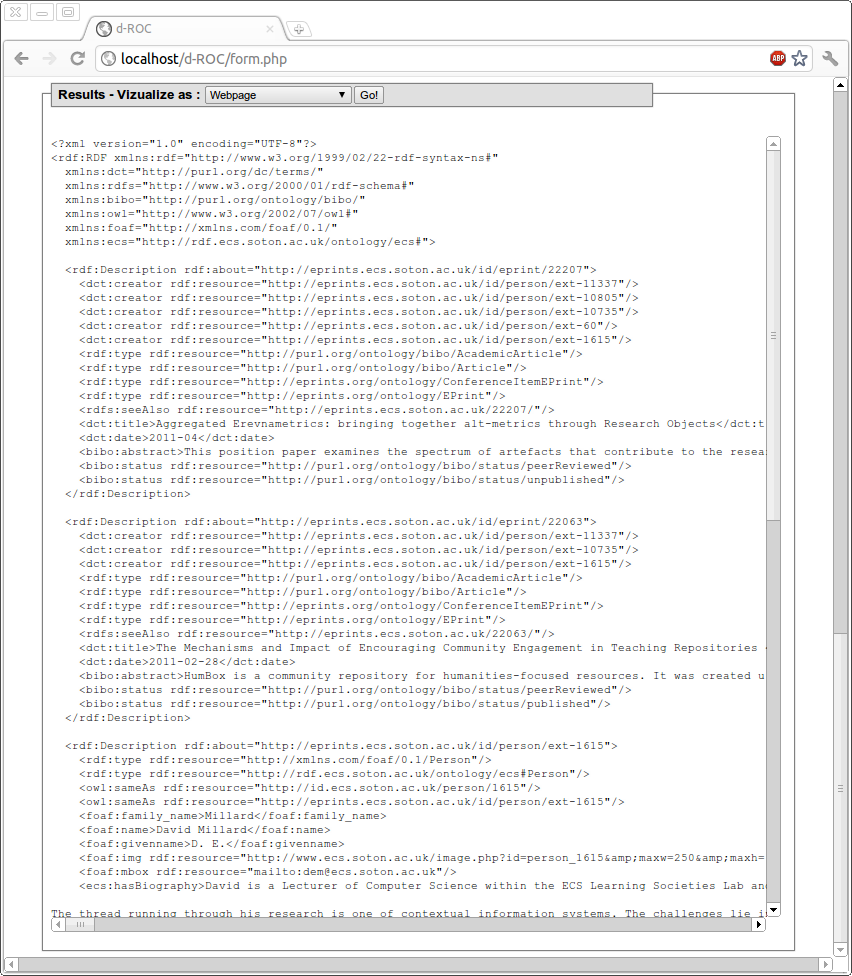
After RDF has been created, they can visualize it in a number of ways – as an automatically generated webpage, as graph, etc (see later blog post about this).
There are also a number of improvements that have been suggested, following some user testing : again, see the relevant blog post.