Archive for the ‘statistics’ tag
06 – Museology no comments
Museum Studies
The museums by themselves have different processes and meanings for the population and institutions. Through these classifications of museums, we can provide a more accurate linkage in between the object of study (or exhibited) and the audience.
Cultural Theory
Through contemporary cultural theory we can incorporate all sort of art practices into the everyday life. This will create our culture. So culture is becoming something less separatist in which art or culture itself no longer belongs to the educated or rich classes. The cultural theory is now being implemented more and more within museums, specially in social history and contemporary collections (Macdondald, 2011). Contemporary cultural theory seeks to utilize culture from a pluralistic perspective.
We inhabit a culture in the sense that we share a certain amount of knowledge and understanding about our environment with others.
We have evolved into a society that shares what Stuart Hall (1997: 18) in Macdonald (2011:18) defines “cultural maps” which makes us question or make judgements the value, status and legitimacy of products or cultural practices.
Within museums we are trying to materialize values and trying to give meaning to objects. For this reason museums within cultural theory are public spaces in which their values and the culture creation is always under debate.
Main theoretical apporach
In order to give meaning to something, we depend on a social construction of a signifying system that creates a shared understanding. The semiotic research of Ferdinand de Saussure, indicates that signifiers and signifieds relate arbitrarily. This means that perhaps the meaning or classification (curation) system to an object could be completely different from the perspective of a different culture.
When an artifact is being curated, this is attached or linked to an interpretation system that could be attached to a single cultural ‘string’. Taking the post-structuralist approach, we can provide a structure of interpretation that adapts to the cultural needs of the artifact or the audience. The attempt to materialize culture and present how an object can change through time, tends to fit to the vision of the post-structuralist thinking.
For this project this could be the way in which post-structuralism becomes the main way of presenting an object of study. A multi curated object presented from different cultural backgrounds and within different cultural audiences. Although the object can be presented with several meanings, “poststructuralist theory does not automatically imply that the material world ceases to exist” (Macdonald, 2011:21), but it will be understood from different perspectives or meanings.
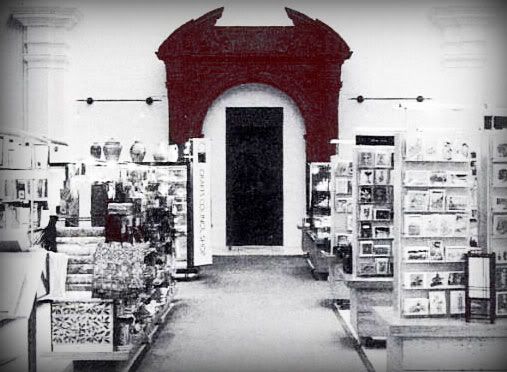
V&A Mark Lane Archway (Gallery 49)
The Object
Before photography, multimedia and all the new technologies, the object by itself was the way to present the culture or places which it came from. For this reason I think that the object presented should contain enough information to communicate or represent the specific qualities of a culture. When the object is unique it will be a challenge to transmit the embedded information to a replica that could be presented somewhere else. The use of modern manufacture technology and prototype making can assist with this process. But it will be the correct adaptation of the object and its environment what will be able to make the correct communication to the audience possible.
Bibliography
MACDONALD, S. 2011. A companion to museum studies, Malden, MA ; Oxford, Wiley-Blackwell.
PEARCE, S. 2001. Interpreting Objects and Collections, Andover, Routledge, 2001.
05 – Information Systems no comments
Information Systems
O’brien (2007) defines an Information system (IS) as any kind of organized combination of people, hardware, software, communications network, data resources, and policies and procedures that stores, retrieves, transforms, and disseminates information in an organization.
The Framework.
There are 5 main areas that build the framework for the information systems. All these elements play an important role in the process of building the research project.
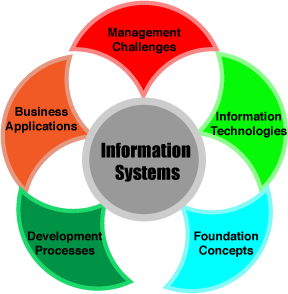
Foundation Concepts
To develop an information system, it is important to understand the behavioral, technical, business and managerial elements in order to develop the components for the Information System.
Information Technologies
In this area we will focus on the hardware, software, networks and data management that will affect the project in regard of its development, concept development and management.
Business Applications
Concepts like e-commerce can influence or provide ways of how the management can be implemented in an Information System like the one required for the Museum application.
Developments Processes
This will be focusing on the planning, development and implementation of the system(s) to meet the requirements of the problem or situation.
Management Challenges
Through this process, we will focus on delivering and managing effectively the information technologies at the end-user, business or int this case a multiuser/global institution.
Inside Management Systems
There are several types of Information Systems. They are usually classified into two different groups: Operations Support Systems and Management Support Systems.
Operation Support Systems:
- Specialized Processing Systems
- Transaction Processing Systems
- Process Control Systems
- Enterprise Collaboration Systems
Management Support Systems:
- Management Information Systems
- Decision Support Systems
- Executive Information Systems
- Specialized Processing Systems
There are five major resources focusing on the relationship with the IS and the products (O’brien, 2007)
- People Resources
- Specialists – software developers or system operators
- End Users – the person who uses the IS
- Hardware Resources
- Machines – computers, monitors, drives, printers or scanners
- Media – Storage, disks or paper forms
- Software Resources
- Programs – operating systems, editors or payroll applications
- Procedures – data entry procedures, error correction, paycheck distribution procedures
- Data Resources
- Communication media, communication processors, network access, control software
- Information Products
- Management reports, business visual display and paper forms
All these elements and areas can help us to visualize the complexity of the development of an Information System. We need to know what do we want from the organisation (system) to do? An organisation that includes people is more complex to manage than one that doesn’t (Wilson, 2001). For this, it is important to analyse the system implemented. Users or a human response will vary which will vary the judgement of the system.
To avoid judging problems we have to follow a specific methodology. We have to define a problem first of all. From here we can start gathering the appropriate techniques to solve this problem. The implementation or application of these techniques will allow us to go to the next step if effective or back to the previous one if unsuccessful. We also have to analyse the cost/effective solution. After these steps we can finally implement the solution.
So we have to solve a problem. But, who is defining the problem. What seems to be problematic for one person can not appar to be so for another one. Wilson (2001) explains that instead of focusing on a person’s problem or a problem, we have to focus on defining a situation that is problematic. I believe this will help the project not to isolate on a single person’s perspective.
Bibliography
O’BRIEN, J. A. & MARAKAS, G. M. 2007. Introduction to information systems, Boston, Mass., McGraw-Hill.
WILSON, B. B. 2001. Soft systems methodology conceptual model building and its contribution, Chichester ;, Wiley,.
04 – IT Modelling / Reporting Experiments (Statistics) no comments
Hypothesis and Experimentation
The scientific method
The hypothetico-deductive aspect of the scientific method focuses on the observation. This observation leads to a guess or logical guess called the hypothesis that tries to explain how a system works. From there, some predictions are made from this hypothesis and the experimentation or tests begin to try to prove it.
After the experimentation, the results can only be either consistent or inconsistent with the hypothesis.
These sets of experimentation will allow the hypothesis to be more consistent with the implementation of the project. But it is important to link the results properly with the hypothesis. This is where the statistics come in.
Statistics
Statistics are use in many different industries. Statistics will allow us to make decisions about large numbers of subjects which we can be able to group into some sort of systems. This way we can see patterns or data that is not visible through ‘static’ numbers.
It is extremely important to understand how statistics work. This is due to the necessity to analyse the information inside them. If we can not produce a proper statistical model, perhaps we won’t be able to make a good decision about our project. Also, if we can not understand statistics, there is no way we can see errors or disprove a theory or result.
Graphs
Once we have developed the statistical models we also have the option of visualizing this data. Or perhaps analyzing more in depth the information provided.
Mean, Error, Percent Error, and Percent Deviation
All these arithmetical/statistical tools can help us to understand our data. For example the Percent Deviation will allow us to understand or to see the whole extent of the data, not only the mean number.
| σ = |
|
Percent Deviation |
All statistical models are methods of obtaining the probability of success of our experiments which will help making a decision about our hypothesis or group analysis
Reporting Experiments
Through the report is where the explanation about the study. Peter Harris (2008) points 5 elemental items for the report.
- What you did
- Why you did it
- How you did it
- What were your findings
- What do you think it shows
This can then be translated to a formal document presentation like this:
- Title
- Abstract
- Introduction
- Method
- Results
- Discussion
- References
- Appendices
So, through this report we are intended to provide the information and the appropriate material. For this we also have to consider our reader. Who is intended to see our information. This is important because perhaps we will have to give an introduction to our area of study. If we are presenting the document to Computer Scientists, perhaps we need to give and induction to Heritage or Visual Communication.
Within museums
The statistics and the report provided is also an intrinsic part of the analysis. Before even starting to provide model experimentation, it is important to provide a hypothesis. Something like:
- What are the main reasons why small museums don’t have access to big collections?
- How many visitors does each museum have per year/per day/per month?
- How many times does an expensive collection travel through different museums?
It is important to start analyzing this type of information in order to visualize the real requirements not only of the project but also of the museum. problem or situation.
Bibliography
Brookshear, J. G. (2010). Computer science an overview. (11th ed.). Addison-Wesley,.
Harris, P. (Peter R. ). (2008). Designing and reporting experiments in psychology (3rd ed., p. 284). Maidenhead :: Open University Press,
McKillup, S. (2006). Statistics explained an introductory guide for life sciences (p. 267). Cambridge :: Cambridge University Press