
It’s been two months since we moved Blackboard to the new data centre and performed the various hardware upgrades (see the post we made about that here), so it’s about time that we take a look at how the service has performed since it went live, and how it coped with the demand of the exams and the start of term. We’ll also take a look at usage patterns over the period.
Our own internal monitoring of the new platform shows that the average response time (this is the amount of time it takes to connect, request and receive the HTML content response) of the front page of Blackboard across all front-end web servers is between 66.5 and 79.9 milliseconds since we put it live. As a comparison, the average response time of the old platform since monitoring began was between 478.8 and 687.6 milliseconds. This means we have cut the response times by somewhere in the region of 83% and 90%! To phrase that slightly differently: response times are around TEN TIMES better.
As good as that is, it’s also good to note that we have seen more consistency in performance. Prior to us performing the migration and upgrade, we were seeing Blackboard performance very differently throughout the course of the day. On the old platform, backups of the database and bulk operations to update users on courses used to cause Blackboard to grind to a halt and become very unresponsive – which we would be able to see on the response time graphs. Response times could end up in the 20+ seconds for several minutes at a time. On the new platform, these operations don’t register any impact on our graphs of response times. The worst ever response time we’ve had on the new platform is a fraction over 10 seconds – an incident which has only happened once out of nearly half a million tests. In fact out of all of those tests, only 82 have been more than two seconds and only 492 have been over a second – around 0.1%. The service currently has a 100% uptime.
Google Analytics data shows us additional information regarding page load times. The improvement in responsiveness has helped cut page load times (so this includes the response time, as well as the amount of time to download all supporting content, e.g. scripts, stylesheets and images) by as much as 60%.
It was nice to see that these improvements were noticeable by our users too – several commented on Twitter that they’d noticed that Blackboard was more responsive. The improvements were noticeable at our Malaysia campus (USMC) too. Despite the latency between Southampton and Malaysia, one member of staff told us:
…I am currently teaching at USMC and can confirm a distinct qualitative improvement in Blackboard response times. Although I can’t quantify the improvement, suffice to say it is responding faster here at USMC than it was when I last used it in Southampton!
So what about usage? The reason we waited until we were in semester two before writing this blog post was so that we could see the impact of exams on performance, and also because Blackboard would naturally be very quiet around Christmas (hence why we’d moved it at that point in the first place). In the last two weeks of 2013, we were seeing around 4000-6000 logins per day. Over the days around Christmas, this obviously dropped significantly, but it was interesting to note that there were still 1740 logins to Blackboard on Christmas Day! New Year’s Eve and New Year’s Day were busier than Christmas, with both days having just over 4600 logins.
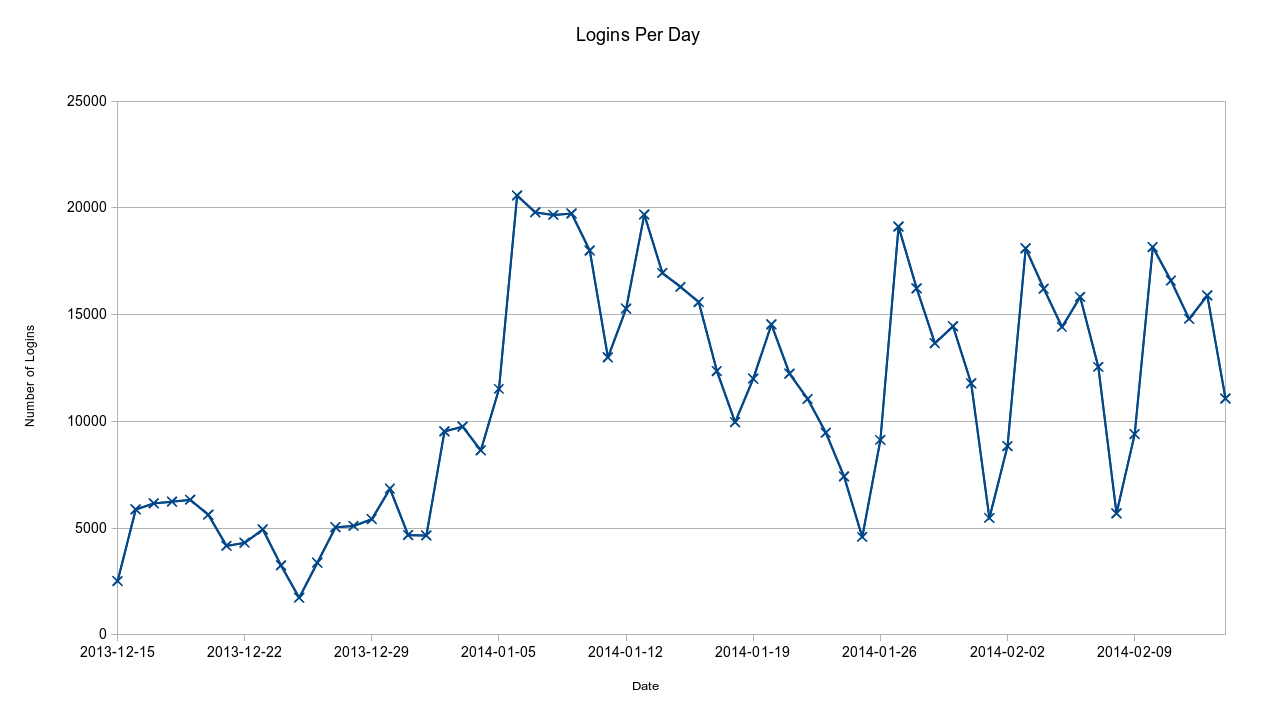
Number of logins each day since go-live on December 15th
The busiest day for Blackboard since the upgrade was Monday 6th January, when over 20,000 people logged in – not unsurprising, being the first day of term. That first week was busy every day of the working week clocking up more than 18,000 logins. In terms of logins, Mondays average out as being the busiest day of the week, with Saturdays being the quietest. The granularity of our data for logins goes down to the hour, so for the average day, there are fewest logins between 4am and 5am, and most between 11am-12pm, followed by a noticeable dip for lunchtime in the following hour. All this can be seen on the graphs below.
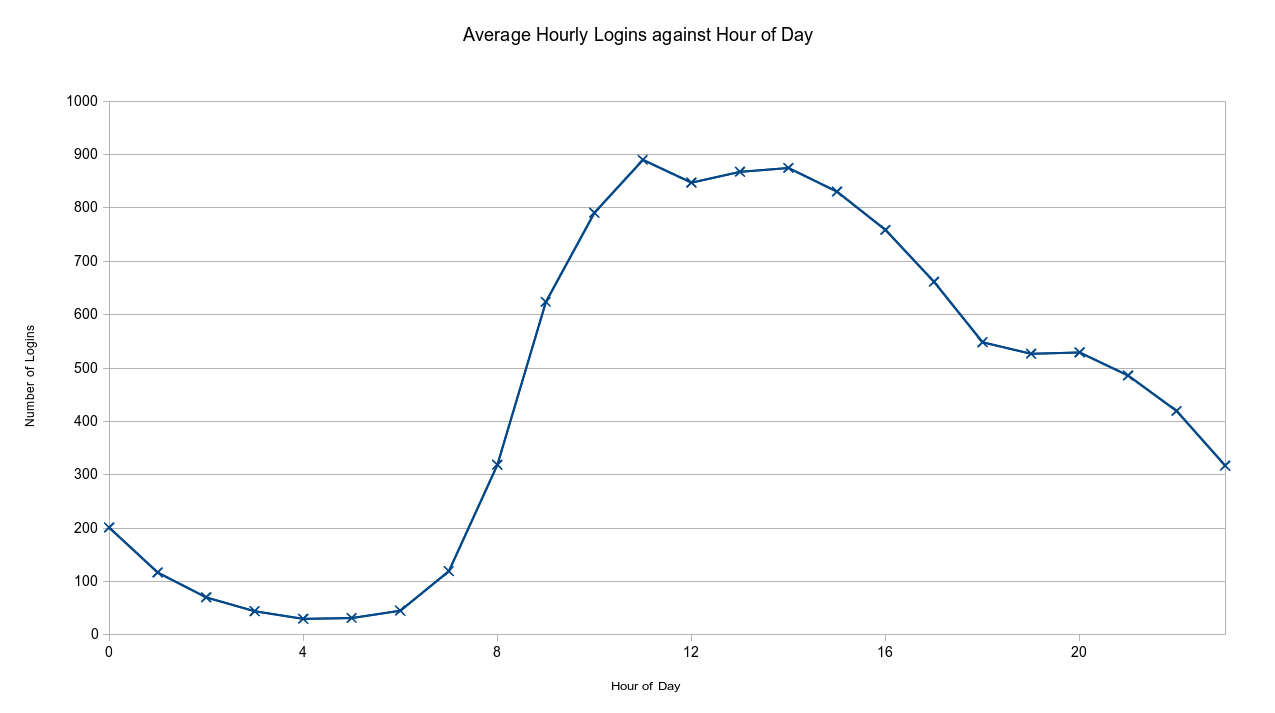
Average Hourly Logins against Hour of Day
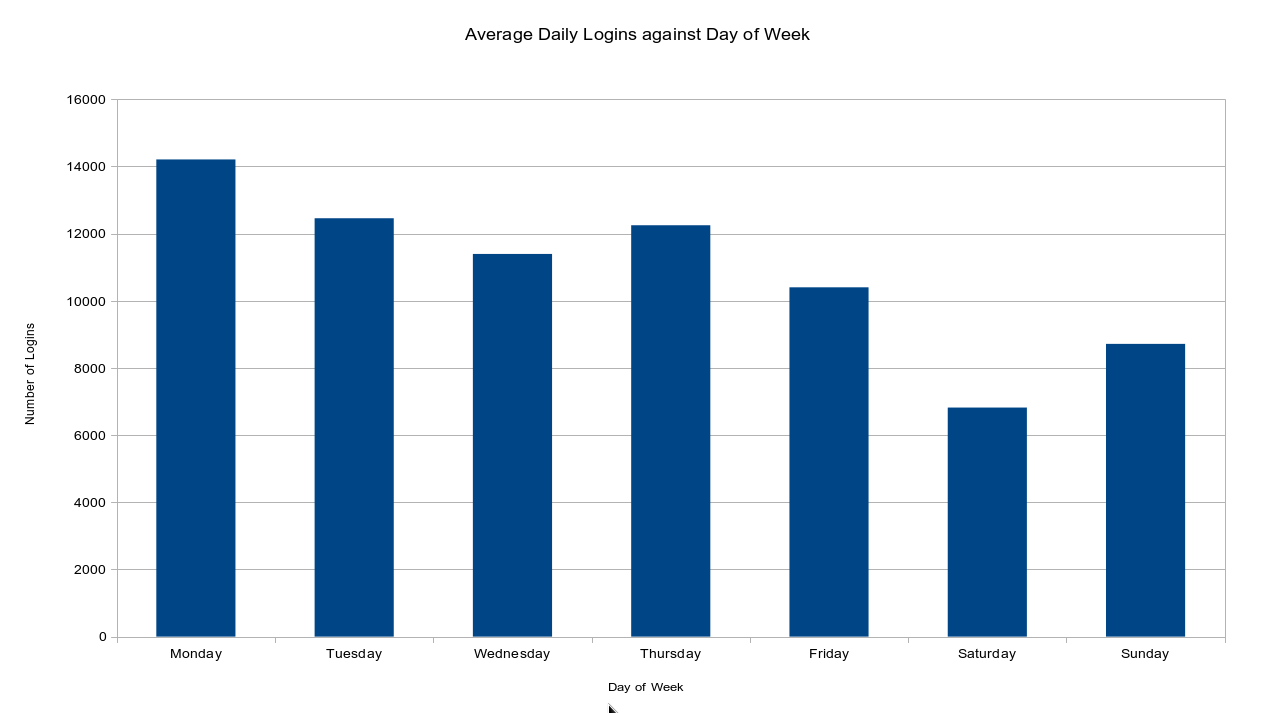
Average Daily Logins against Day of Week
Google Analytics data similarly matches the above, additionally telling us that there have been just short of 8 million page views since go-live.
To summarise: all is going very well in the world of Blackboard performance and stability. The entire Blackboard support and infrastructure teams are meeting up several times in the next few weeks – once to discuss the infrastructure, stability, performance, and looking at what we want to do progress and any improvements that we want to make. More importantly, we’ll be meeting up to discuss the next software upgrade to Blackboard, which will be happening in June this year – more on that later in the year!
Recent Comments