
I feel I’ve written a bit too much about spam filtering recently… but nonetheless, here’s one more, only with some graphs and maps! Attacks against our mail servers have not stopped since my last update – they’ve increased – but despite this, we’ve had very little spam (I won’t go as far as to say none, as I know that’s not true!) go out from our mail servers since! In my last post, I said that we’d had 190,203 attempts to send messages without authenticating. At the time, that seemed like a large number…but we’re now occasionally seeing that kind of number of attempts in a day – we’ve seen 47,040 attempts in a single hour recently. In the last four weeks, we’ve seen over 830,000 attempts!
Attempts at password brute-forcing continues too. Since November 9th, we’ve automatically blocked 189,400 (non-unique) IP addresses for brute-forcing, meaning we’ve seen close to a million brute force attempts in that time period. As the graphs below shows, December 22nd was a day when we were hit heavily on this: we blocked 2,207 IPs in an hour on that day, with a total of 23,761 IPs blocked on that day.
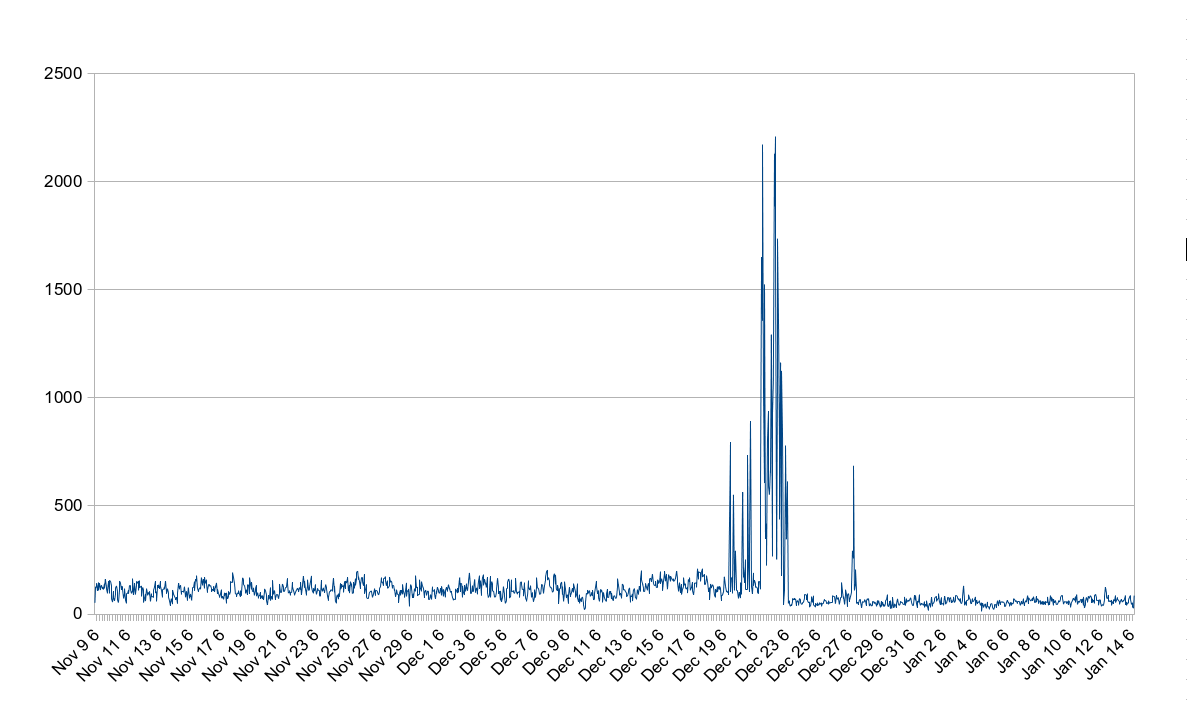
Banned IPs per Hour
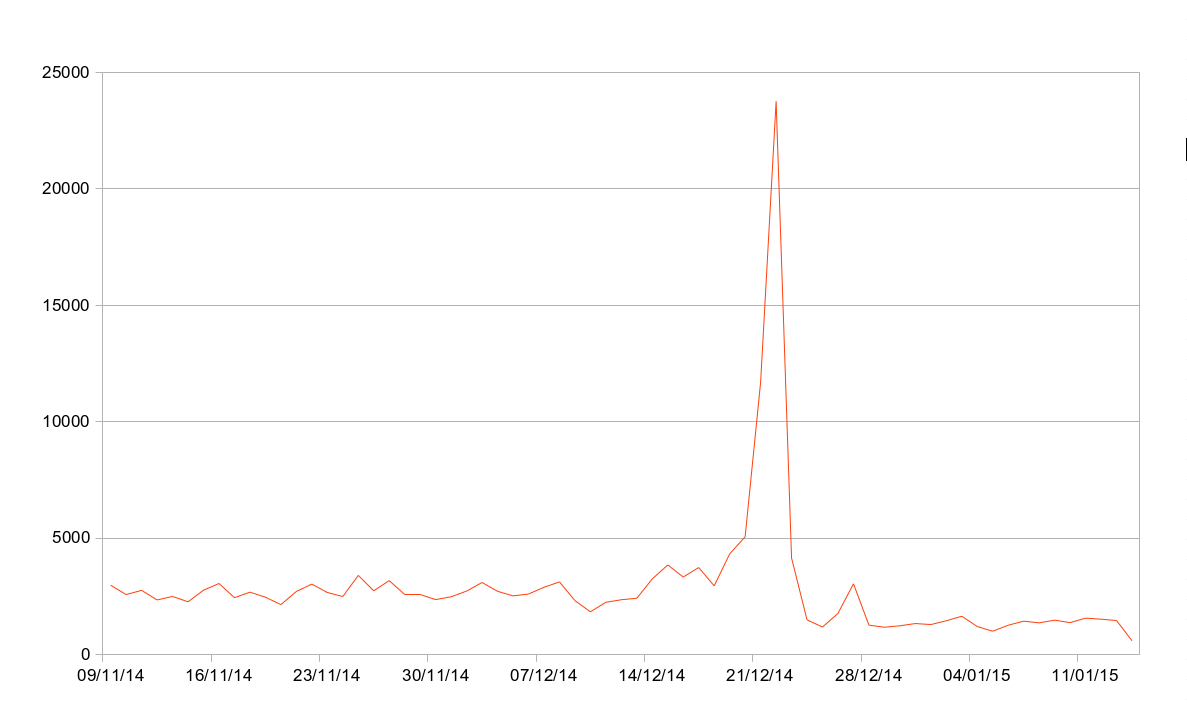
Banned IPs per Day
The graphs also seem to show that the rate of blocks have slowed down since Christmas. Prior to Christmas, we were blocking on average 3,510 IPs a day, and since Christmas it’s down to about 1,450. The data here is however slightly skewed as to help combat the attacks on December 22nd, we started blocking IPs for longer. The effect here is that each IP can’t do as many attempts per day or be blocked as many times per day, hence the reduction on the graph.
A valid question to ask here is “who are we blocking?” Well, the map below shows the countries who’ve had IPs that we have blocked. The grey countries have had nothing blocked at all, and the brighter reds have had more. As you can see, there are very few countries that we haven’t had to block an IP in. (Disclaimer: the locations on this graph are not necessarily the location of the people responsible for sending the spam – these are more likely the locations of machines infected with malware being used to send out spam).
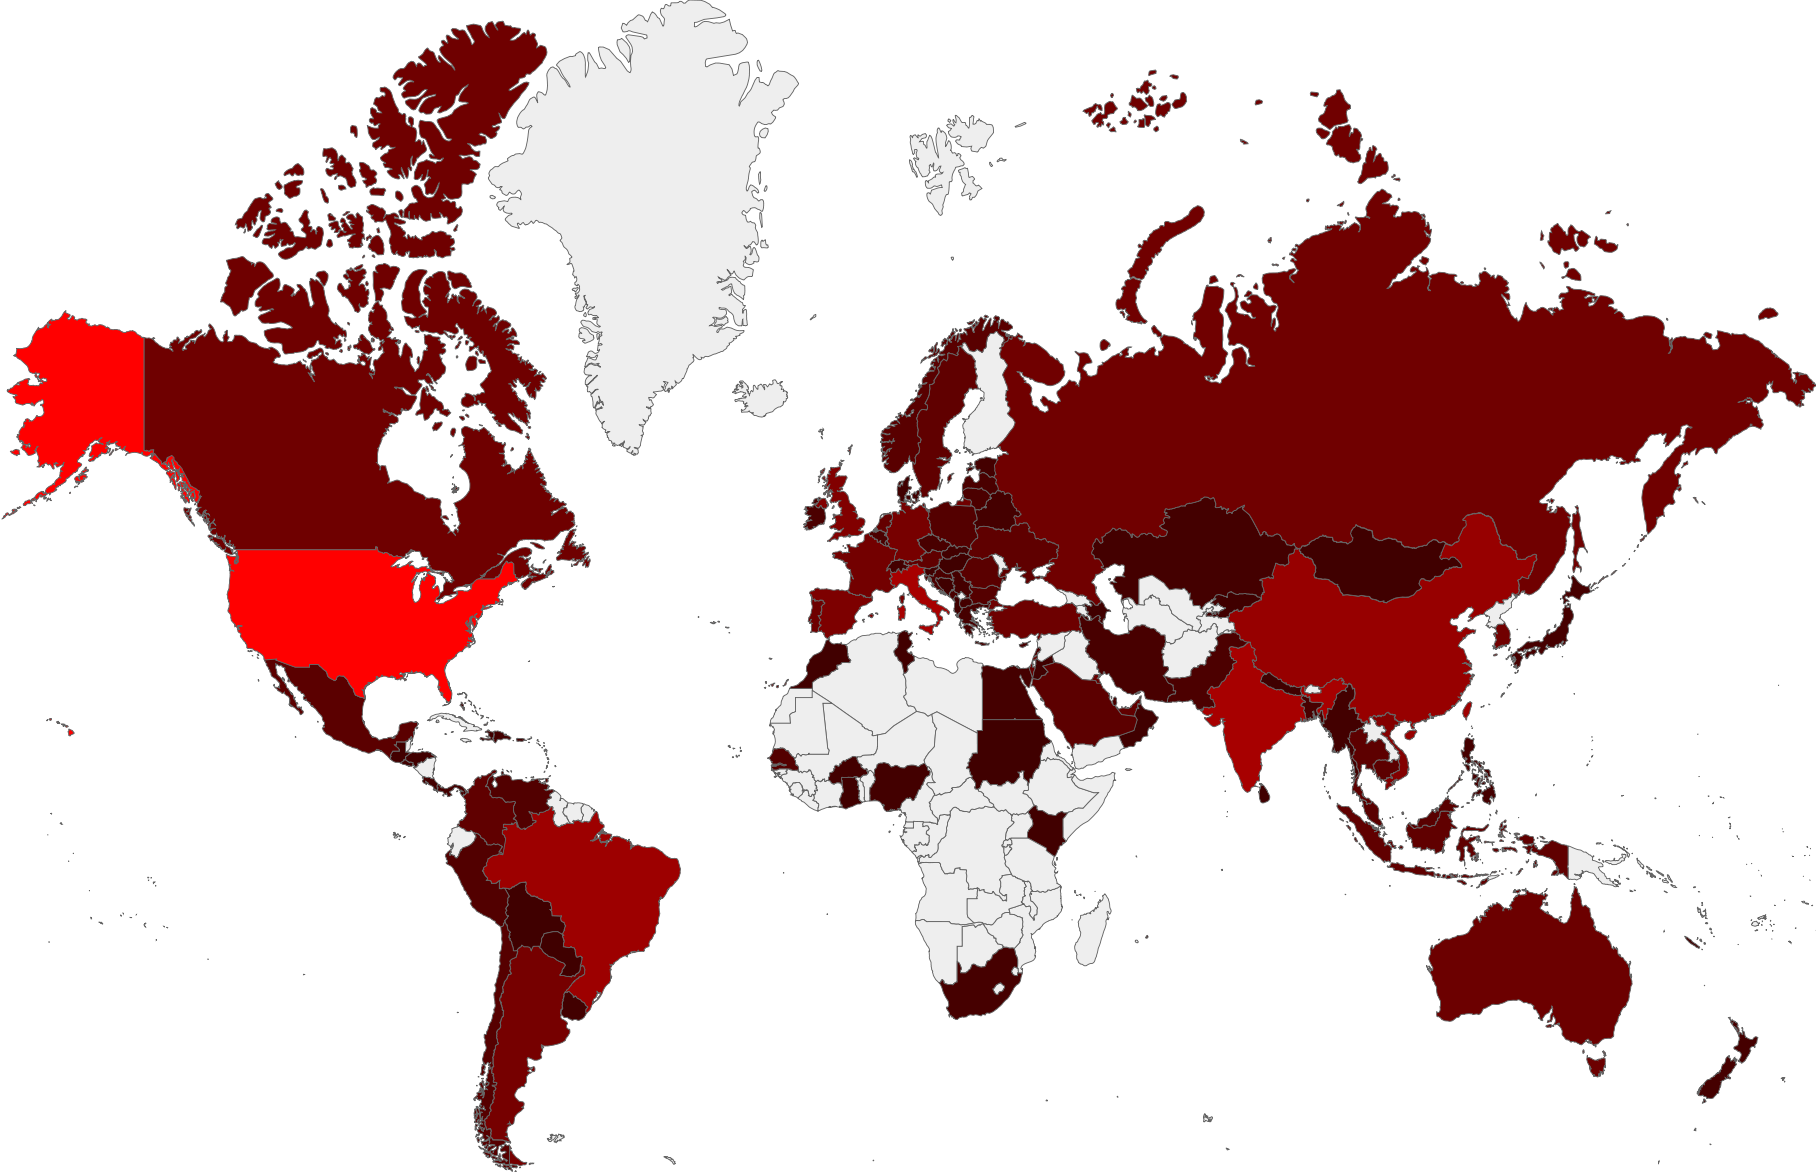
Heat-map of countries who’ve had IPs blocked since November
Thankfully – and this is possibly the most important thing here – the number of compromised accounts we’ve seen has decreased drastically. In my last post, I said we’d detected 28 compromised accounts in October. As the graph below shows, this dropped to eleven in November and only four in December, making it the quietest month in at least a year. In the week leading up to the Christmas break, we didn’t detect and compromised accounts at all, something we haven’t done since March! All that said, January hasn’t been as good – we’ve reset 8 accounts so far this month. These are most likely caused by inbound phishing attempts which we’ve seen a distinct, definite increase in this month.

Password Resets per Week
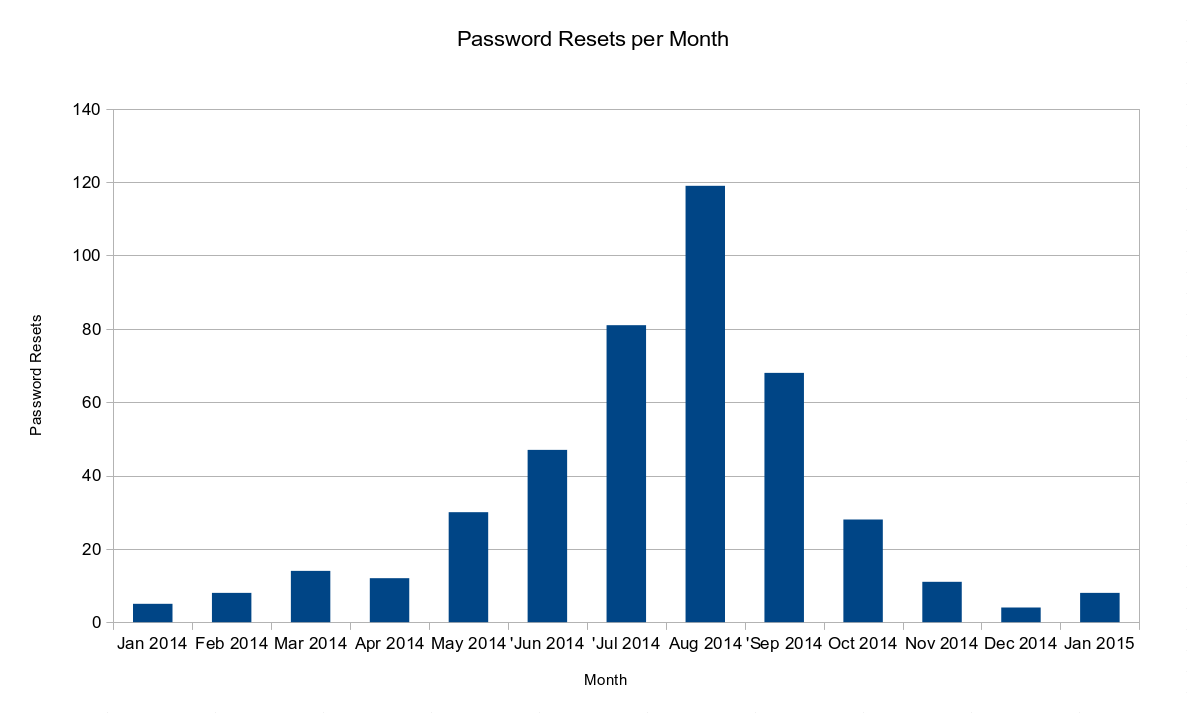
Password Resets per Month
As a final bit of good news, all of our outbound mailservers still have a >95% SenderScore rating, with all our edge SMTP servers having a score of 100% now! Again, we’ve seen no new blacklistings – not one in four months now.
No post about spam would be complete without some negativity though. Some of the attacks we’ve seen in recent weeks have been a lot more manual (less “script-kiddie” stuff) than we usually see. A couple of the compromised accounts we detected were sending out low volumes of spam from our remote-access servers, having downloaded mass-mailer applications once they’d got there. One attack also tried to use University webspace to host phishing scams targeting us with very convincing e-mail login pages. Very worrying, but we caught them in time.
Universities are a big target to attackers – lots of users (meaning a potential for a decent number of less-computer-literate users), lots of accounts, lots of servers, lots of potentially-vulnerable services, and high-bandwidth Internet connections with respected mail relays. The fact that universities are a high-profile target became even more apparent in an attack we saw recently: in one of the above cases of an attack on our remote-access servers, the connection to our server had come from the VPN of another UK-based university. The attacker was sending out phishing scams to other universities and in another case, was downloading VPN access information from other universities using a different compromised accounts at that institution. We’ve naturally spoken to all the universities involved here and advised them of what we’ve seen, and they’ve been very helpful in shutting these compromised accounts down.
It seems that we’re just about back on the winning side when it comes to outbound spam currently, but given the attacks are increasing and getting more complex – no time for us to get complacent.
Recent Comments