MOOC Data Visualisation Hackthon

Exploring and presenting our research data in a readily understandable visual form is an important aspect of communicating our work. Last week at our inaugural MOOC Data Visualisation Hackthon, members of the Web Observatory team and the Web and Internet Science research group at the University of Southampton get together to share and develop d3 skills, explore new datasets, and make meaningful visualisations.

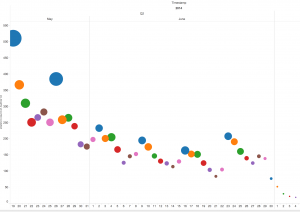
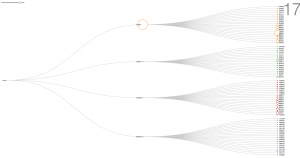
Datasets containing comment data from the University of Southampton’s Archaeology of Portus FutureLearn MOOC were made available on the day. Highlights of the event included Max Van Kleek‘s interactive Dendro visualisations, Paul Booth‘s Tableaux timeline, and Chris Gutteridge – Wikipedia‘s visualisation of domain-specific word occurrence. Many of the participants were new to d3 and spent much of the afternoon following Max’s useful guidelines and exploring the resulting visualisations.
We look forward to showcasing these and other outputs a Web Science Institute event at London’s Digital Catapult showcase next week.
