SLE: Online Survey Results
To find out what students (and staff) wanted from the new learning environment, we drafted a short survey which asked participants to rank several potential widgets (similar to those on the iGoogle page) in order of preference.
Before producing a fully fledged survey however, we reviewed several of the many online survey tools freely available on the internet (you can read the review here). The two strongest candidates from this were SurveyGizmo and iSurvey. Both were very easy to use, as administrator as well as participant, and generated very professional reports. In the end, we chose SurveyGizmo, as the ranking questions in iSurvey are still in beta and this was the key element to the survey.
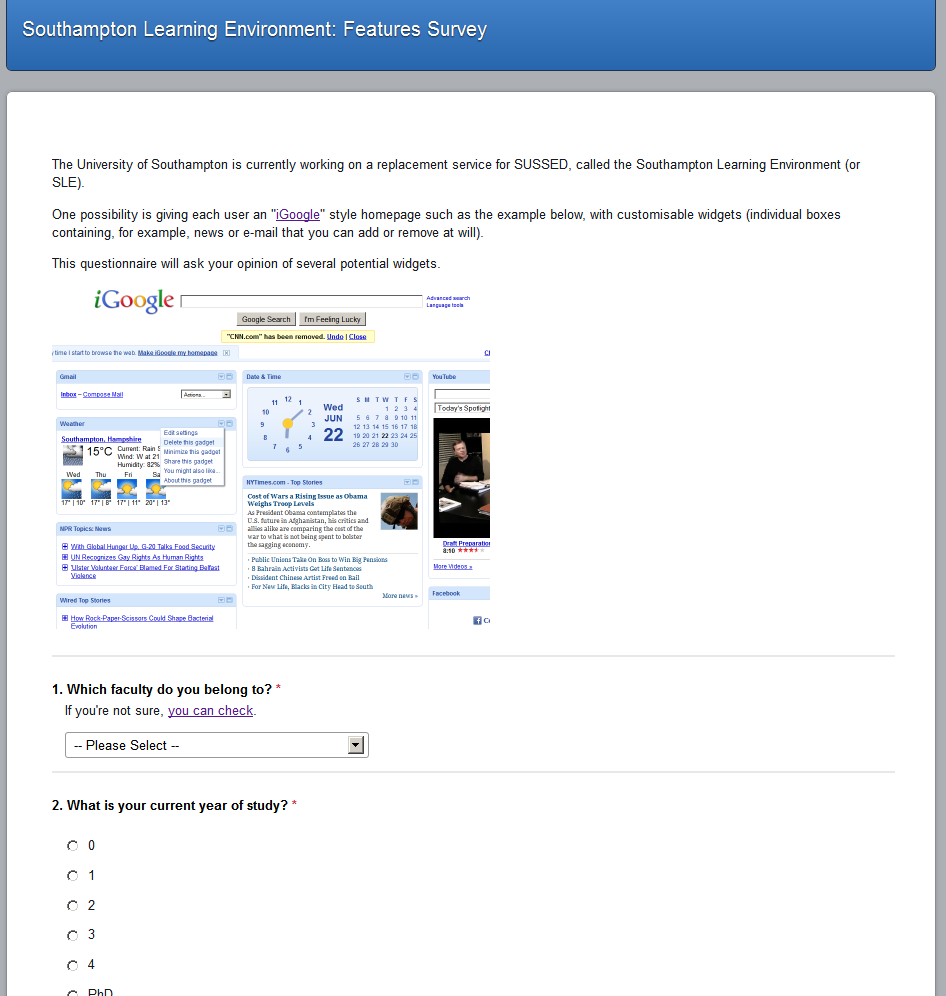
The survey also collects a small amount of demographic information such as faculty and year of study, so we can be sure the results are a reflection of everyone’s needs rather than a select few.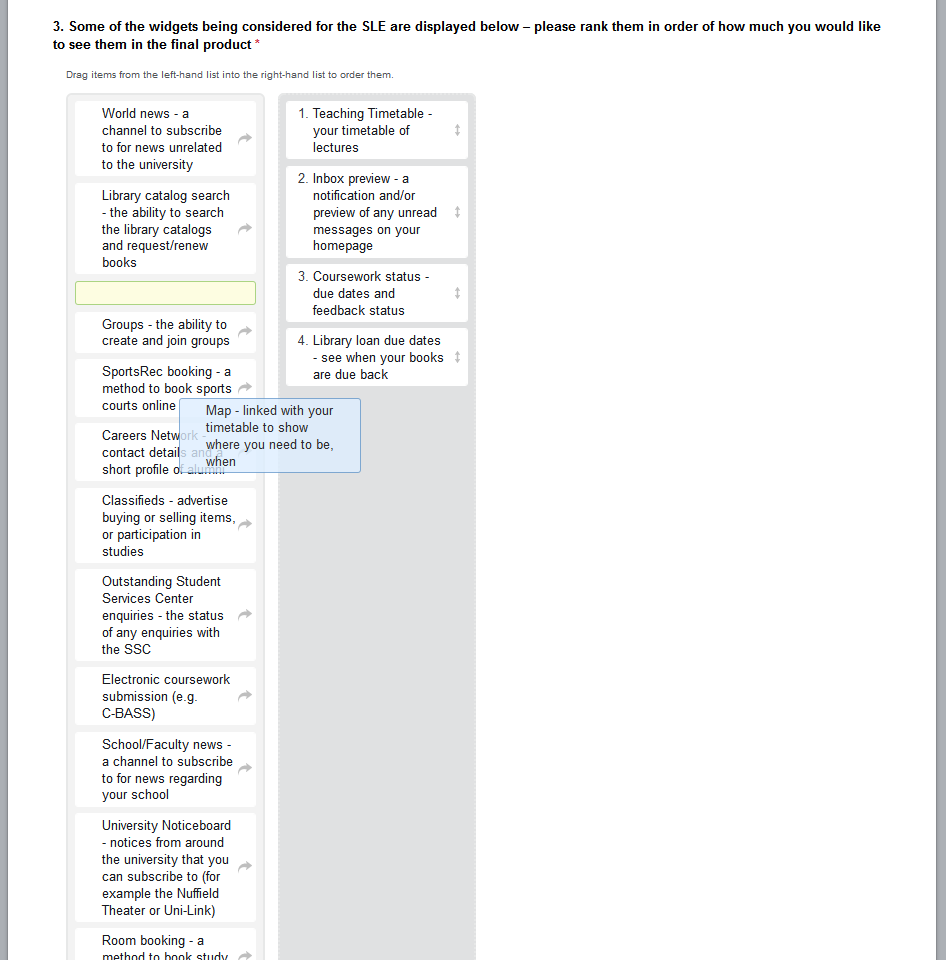 The main body of the survey is made up of an interactive panel, allowing participants to drag-and-drop responses into the order of their choosing – several participants commented on how novel and engaging this method was.
After only a day, we had enough results to take a snapshot of the data (strengthening our view that students are eager to share their opinions on how the SLE could be developed and improved) and generate a report. The survey will of course stay open, so that more data can be collected to give a larger overall sample size for more representative results.

From this chart the breakdown of faculties can be seen and it is clear that the Faculty of Physical and Applied Sciences (containing the schools of Physics and Electronics and Computer Science) makes up the majority. The is perhaps because these respondents are more comfortable taking online surveys (or just check their computers more often!) – whatever the case, this majority of (assumedly) technical users must be taken into account while the initial results are analysed.
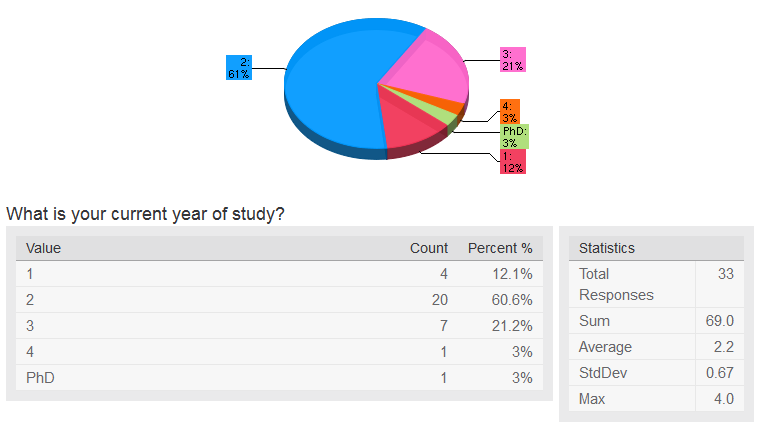 The next question asked the participant’s year of study – in this chart as well there is a clear majority (of second years in this case). However, this is not as much of an imbalance as if there was, say, a majority of staff or PhD respondents.
 Above is a subset of the top ranked widgets that people want to see in the new SLE. As can be seen, the top four (so far) are a teaching timetable, linked with a map and a method of quickly viewing the status of outstanding courseworks and submitting them electronically. This gives us an excellent starting point to begin developing tools that users of the SLE will find helpful.
If you are a member of the University of Southampton and want a say in how the SLE is developed you can take the survey here.