Archive for the ‘supply and demand’ tag
Basic concepts: Economics no comments
“A social science what studies the choices individuals, businesses, governments and entire societies make as they cope with scarcity and the incentives that influence.” Scarcity refers to not having enough money for food, or the inability to do something that you want to do because you have to work. We all face scarcity, but we need to make choices to cope with it, for example, choosing to work over choosing a fun activity because you need the money from working to pay bills. The choices we make are influenced by incentives. It can take the form of a reward or a penalty. If skipping work has a good opportunity of getting a much better job we may be more likely to choose to skip work. This is a just a very simple example, but it also works on a larger scale. If the price of computers drops we may as a society decide to buy more and furnish all schools with good computers.
Economics is a large area is we take into consideration individuals, businesses and entire societies; therefore it is broken up into Microeconomics (individuals and business choices) and Macroeconomics (national and global economy).
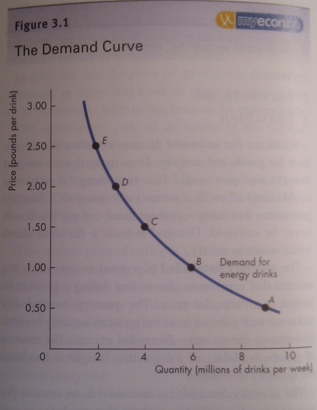
One of the most common economic phrases is “supply and demand”. Demand refers to the relationship between how many people want a product and how much it costs. Supply refers to the relationship between the quantity of the product created and its price. An increase in demand would mean an increase in price and quantity supplied. An increase in supply would mean a decrease in price and increase in quantity required.
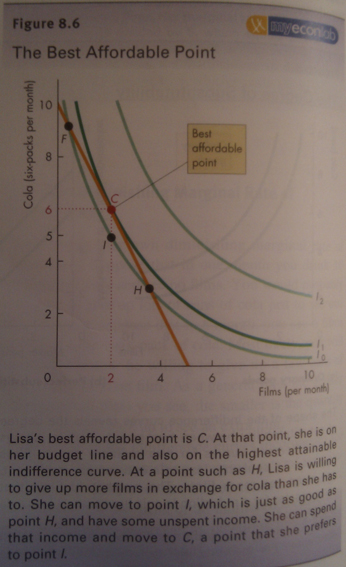
Household consumption choices are limited by income. The budget line is a way of seeing income that can be spent and how it can be spent. If prices of items you buy drop or income increases the Budget Line will change.
Indifference curves are used to show within what combinations of goods the consumer is indifferent to having. For example someone may not mind swapping a packet of cigarettes for an extra drink at the bar or even extra chocolate during the week at work.
Marginal Rate of Substitution is the rate someone will give up n of x to get n of y. If the rate is high an individual will give up a large quantity of x for a small quantity of y. This works the other way round if the rate is low, they will only give up a small quantity of x for a large quantity of y. However, we must be aware that the substitution must compliment or be a fair substitute for the item. If you are very thirsty and are offered a truck load of peanuts for one can of drink you may still decide to keep the drink!

By using these three ideas we can develop a model to predict consumer behaviour. We assume someone will pick the point that benefits them the most, so if it fits inside the budget line (indicating it is affordable) and it lies on the indifference curve (indicating it is a option someone would be happy with) and has a marginal rate of substitution that is equal to the relative price of the items desired, this gives the most affordable point and hopefully that is what someone would choose.
Elasticity is the measurement of how variables can affect each other. An example would be lowering prices to sell more.
Market power refers to the ability to influence the market. A monopoly is when a company has goods or services with no close substitute and has a barrier stopping other companies selling similar products or services. An example would be energy suppliers or the Post Office. Barriers stopping other companies could be a government contract or patent or copyright issues.
Advertising increases total cost of a product, but if the advertising increases sales the total cost of a product will fall.
Uncertainty and Risk
Uncertainty is linked to how certain you are of an event occurring. For example a farmer can never be certain crops planted will grow because they cannot be certain of the weather and other factors that could affect crop growth. Risk is a situation where more than one outcome may occur and the probability of those happening. Probability can be measured accurately or we may have to look at past experience and make a judgement called subjective probability. The cost of risk can be accessed from these probabilities. A person’s attitude towards risk can be assessed using their wealth and how much utility someone attaches to a given amount of wealth. The more wealth you have the higher the utility and the larger risks can be made.
Microeconomics
If the aim of a company is to maximise profit. They can be in any of the below modes of operation:
- Make an economic profit (average total cost is less than the price of each product)
- Make a normal profit (where economic profit is zero)
- If the price is between average total cost and average variable cost the company is loss-minimising. By continuing to produce it may still recover, if it stops it will lose money.
- If the price is below the average variable cost the company should go into shutdown. Losses are minimised by not producing more (wasting money of products that are selling at a loss).
Information and graphs summarised from:
Parkin, M., Powell, M., & Matthews, K. (2008). Economics. Essex, England: Pearson Education Limited.
.
From a Psychology background I can’t help but stick this in to reflect upon. In order to utilise economics you are assuming that the consumer or the company has the aim of maximising profits and that they will always make the best rational decision. However, luck and cognitive dissonance may be more of a factor than simply “working out the numbers”. Daniel Kahneman: How cognitive illusions blind us to reason.