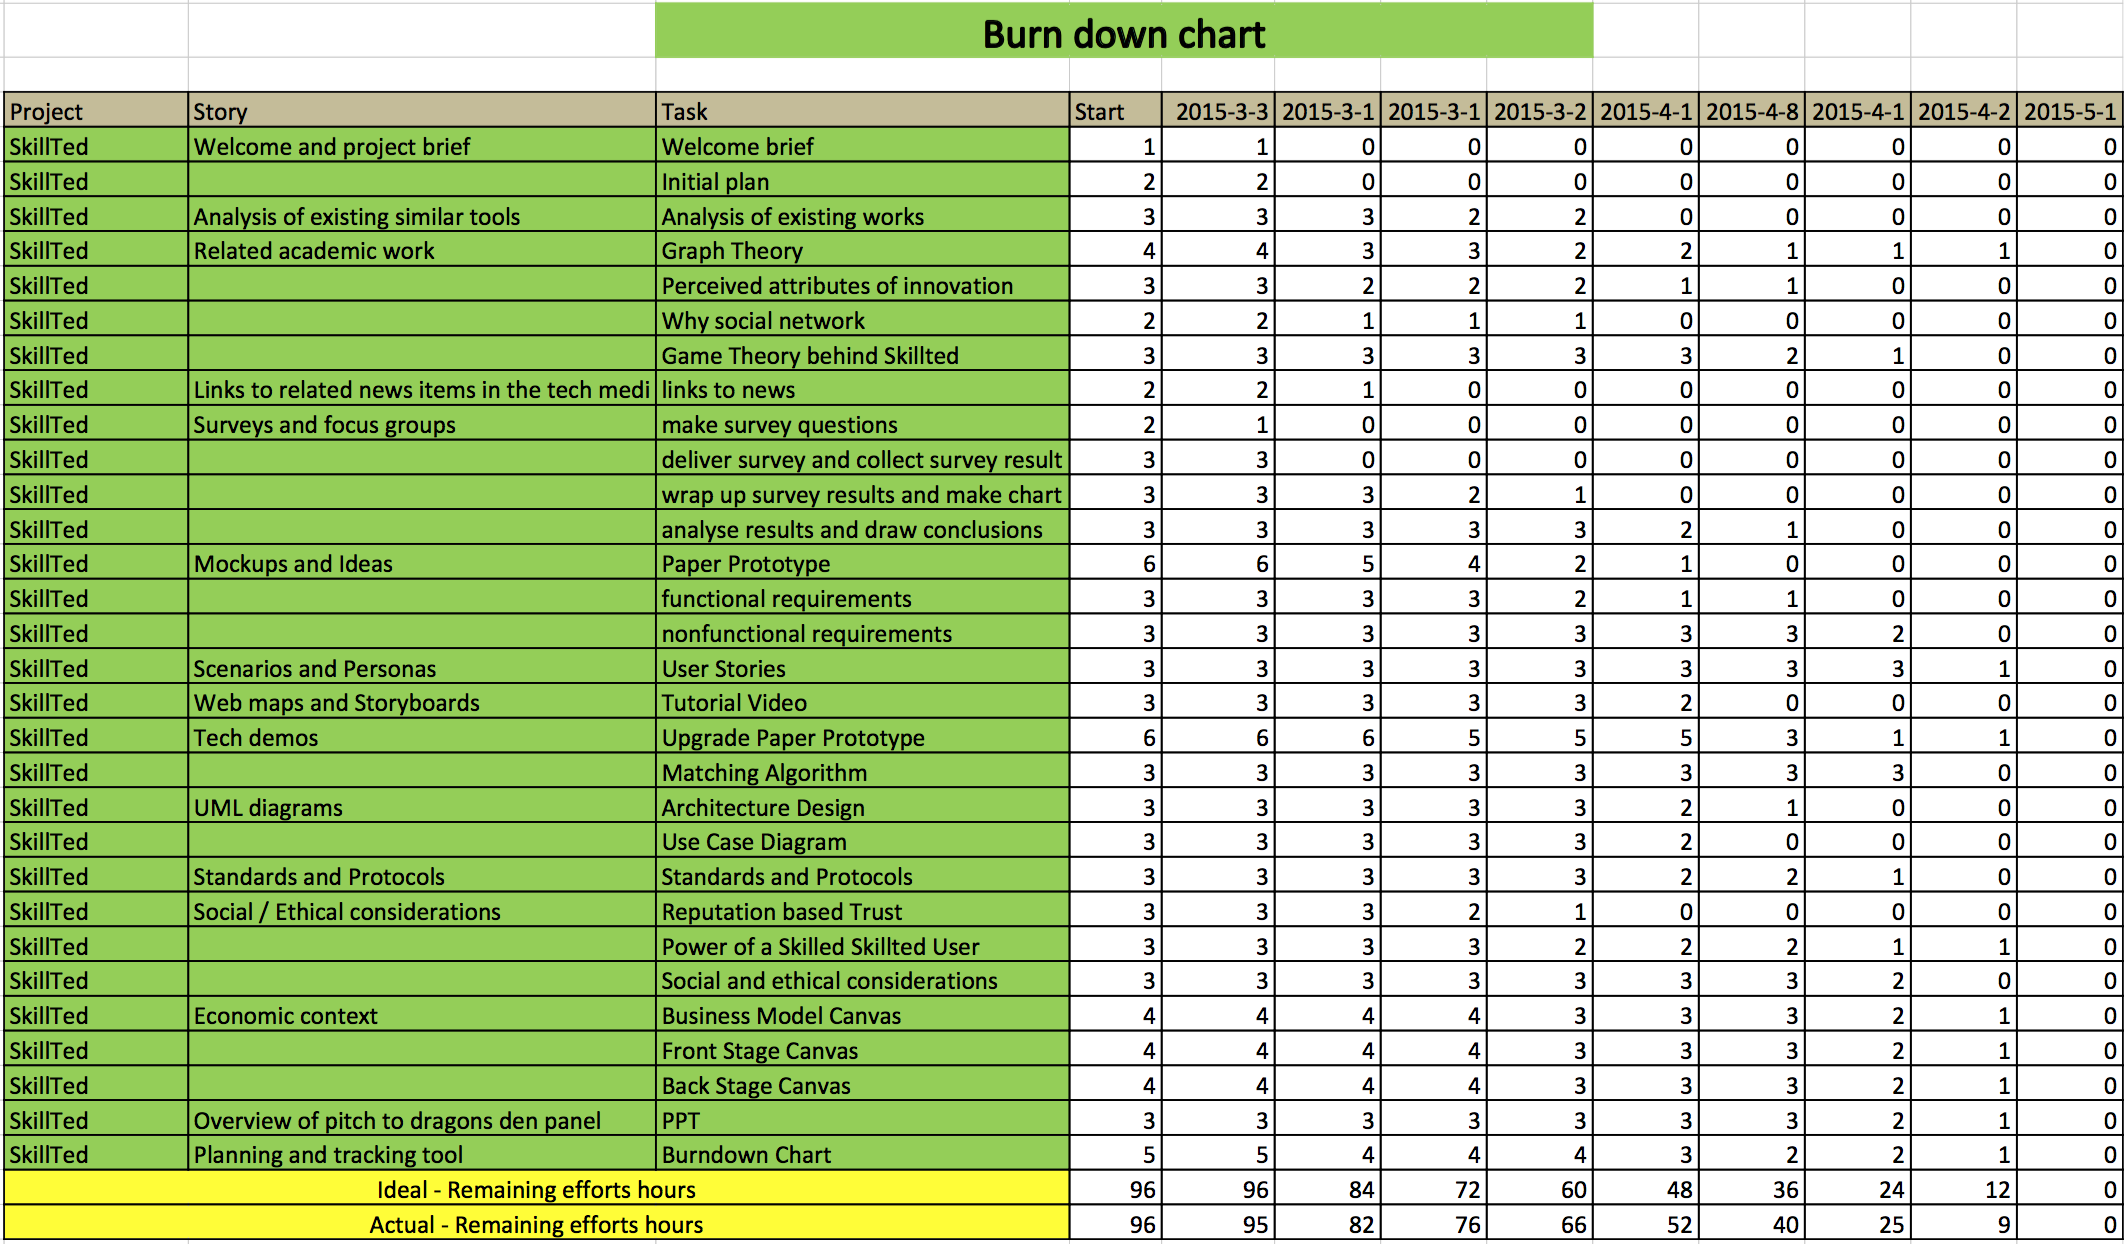
We adopted burndown chart to keep track on our tasks, which is considered an effective planning and tracking tool. We intended to use remaining effort hours to measure and adjust our efforts on individual tasks.
Why we choose burndown chart?
In order to make sure all tasks can be accomplished on time, our team updates estimated effort on every task in every weekly meeting, which enable us to keep awareness of scope and schedule about tasks. Compare actual progress with ideal progress we can easily find out whether our progress meet as planned or not. As remaining effort hours weekly updated, risks can be detected once occurred. For example, when the actual progress line is way above ideal progress line, tasks should be amended to promise all tasks can be accomplished on time.
Record table on detailed story points and Tasks
Conclusion
Basically, the figure above shows a smooth flow comparing ideal progress line with actual progress line, which indicates we follow a good pattern on our project these days. Although during the Easter holidays our progress was a bit falling behind, we speeded up to accomplish our tasks eventually.


Please comment with your real name using good manners.