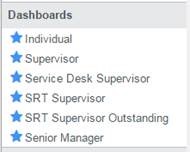
A set of dashboards has been created that allow people to get a better overview of their work at an individual, team and departmental level.
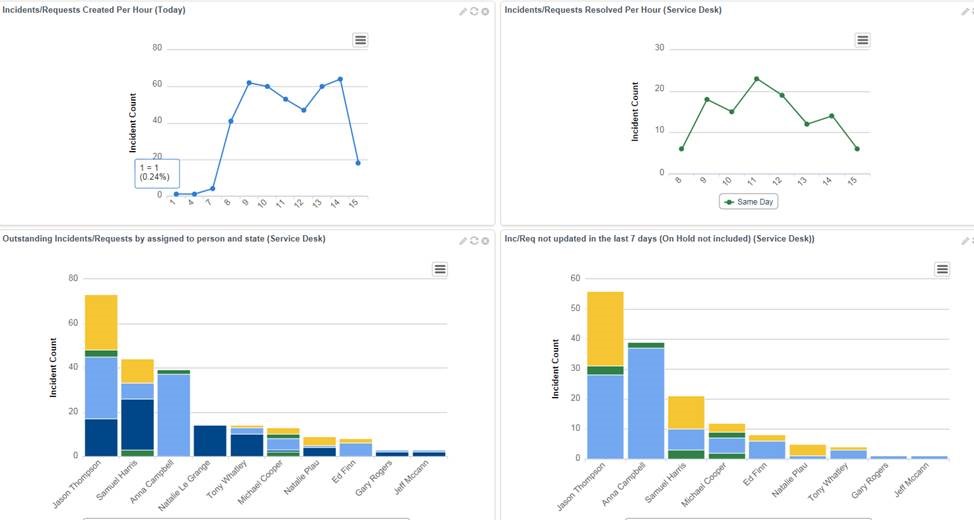
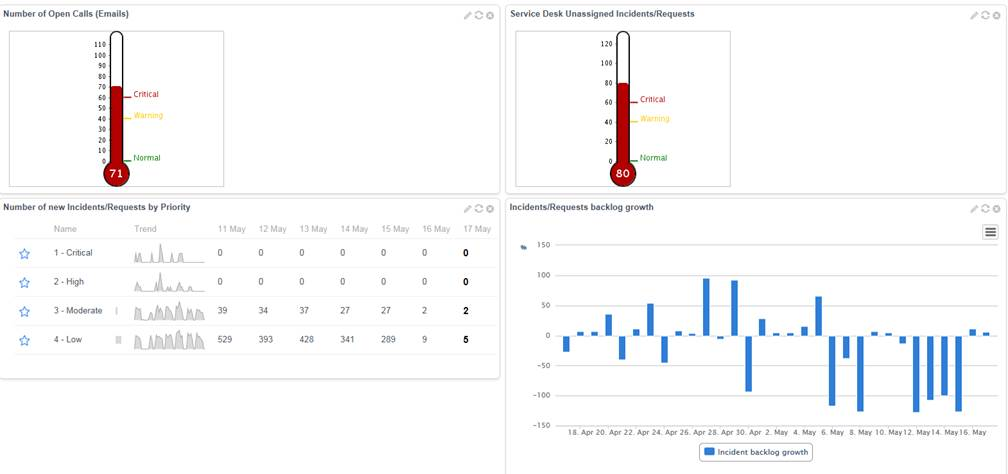
These dashboards include a series of charts, tables and gauges to identify workloads and priorities based on ticket volumes, age, category and other factors.