The Gantt Chart 04
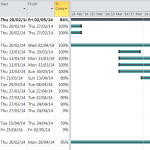
99% of project has been completed, 01.05.2014 Tasks done Code Snippets Standards and Protocols Implement Prototype Privacy Policy Usability Test Video of System Prototype in Action Overview of pitch to dragons den panel

99% of project has been completed, 01.05.2014 Tasks done Code Snippets Standards and Protocols Implement Prototype Privacy Policy Usability Test Video of System Prototype in Action Overview of pitch to dragons den panel
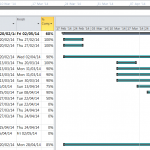
60% of project has been completed, 18.04.2014 Tasks done Related Academic Work Mockups Scenarios and Personas UML Diagrams System Specification Tasks on progress Interview with users Code Snippets Standards and Protocols Implement Prototype Privacy Policy Issues Online Survey- Ethical issue, access right to isurvey We planned to do an online survey to get some feedback from our potential users, so… Read more →
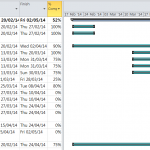
52% of project has been completed. Tasks done Ideas Analysis of existing similar payment system Story Boards Tasks on progress Related Academic Work Mockups Scenarios and Personas UML Diagrams
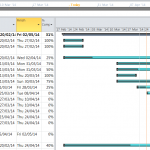
A Gantt chart can be used for Agile methods to manage the design and build activities for engineering projects. The Gantt chart in the picture illustrates our QuidLink project schedule such as the current schedule status and percent complete. 31% of project has been completed. 25.03.2014